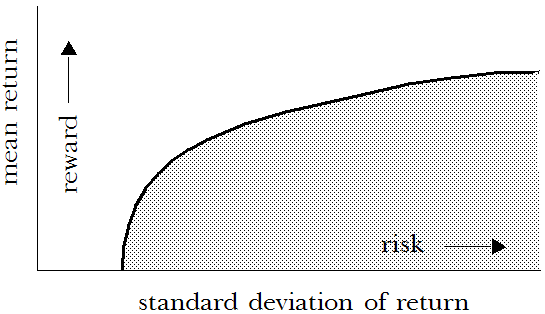
If you were to examine all the possible combinations of investment strategies for the assets described for Portfolio Revisited.xls, you would notice that each portfolio had a specific mean return and standard deviation of return associated with it. Plotting the means on one axis and the standard deviations on another axis, you can create a graph like this:
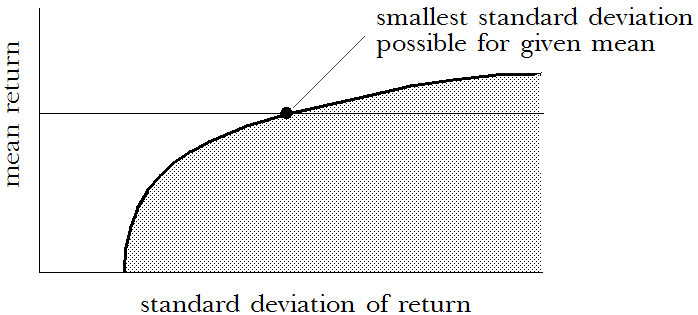
Points on or under the curve (values lower than the curve) represent possible combinations of investments. Points above the curve (values higher than the curve) are unobtainable combinations given the particular set of assets available. For any given mean return, one portfolio has the smallest standard deviation possible. This portfolio lies on the curve at the point that intersects the mean of return.
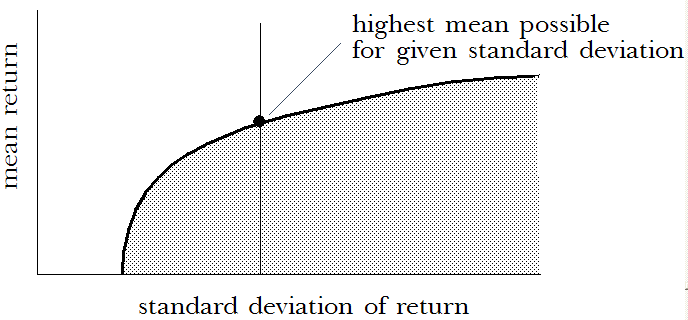
Similarly, for any given standard deviation of return, one portfolio has the highest mean return obtainable. This portfolio lies on the curve at the point that intersects the standard deviation of return.
Portfolios that lie directly on the curve are called efficient (see Markowitz, 1991 listed in the publication references in the OptQuest section of the Oracle Crystal Ball Reference and Examples Guide), since it is impossible to obtain higher mean returns without generating higher standard deviations, or lower standard deviations without generating lower mean returns. The curve of efficient portfolios is often called the efficient frontier.
Portfolios with values lower than the curve are called inefficient, meaning better portfolios exist with either higher returns, lower standard deviations, or both.
The example in Tutorial 2 — Portfolio Allocation Model uses one technique to search for optimal solutions on the efficient frontier. This method uses the mean and standard deviation of returns as the criteria for balancing risk and reward.
You can also use other criteria for selecting portfolios. Instead of using the mean return, you could select the median or mode as the measure of central tendency. These selection criteria would be called median-standard deviation efficient or mode-standard deviation efficient. Instead of using the standard deviation of return, you could select the variance, range minimum, or low-end percentile as the measure of risk or uncertainty. These selection criteria would be mean-variance efficient, mean-range minimum efficient, or mean-percentile efficient.
The mode is usually only available for discrete-valued forecast distributions where distinct values may occur more than once during the simulation.


