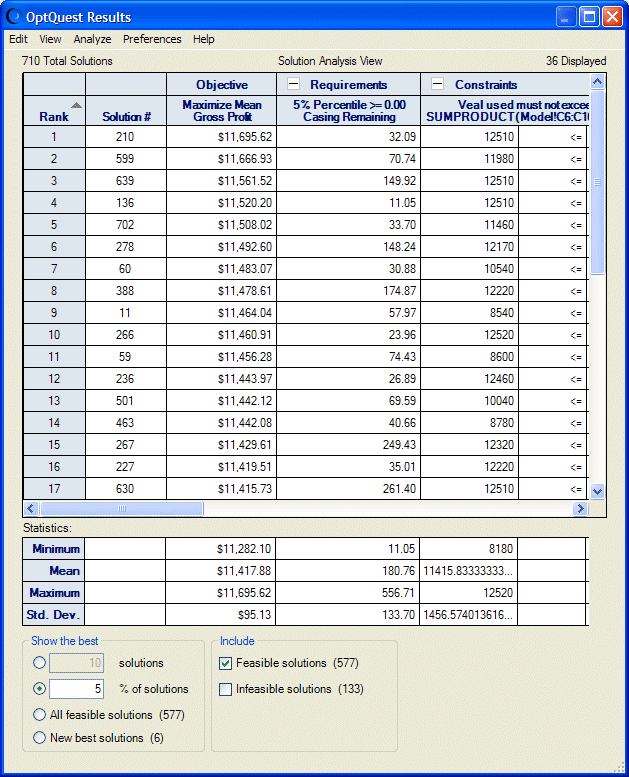
In Solution Analysis view, the OptQuest Results window lists the best solutions found during the optimization. By default, the top 5% of solutions are sorted by the objective value. Controls at the bottom of the window indicate how many solutions to view. Statistics are calculated for the solutions shown.
While OptQuest is running, Solution Analysis view shows the new best solutions, except for Efficient Frontier analyses. The top ten solutions still show when an Efficient Frontier analysis is running. |
To display Solution Analysis view, select View, and then Solution Analysis in the OptQuest Results window menubar.
In the Show The Best group, indicate whether to show a specific number or percentage of the best solutions or all solutions. Your entry defines the analysis range. For example, if you want to examine the top 10% of all the solutions, select __ % of Solutions and enter 10 in the box.
You can select whether to include feasible, infeasible, or all solutions. If you have requested an Efficient Frontier analysis, you can select just the solutions for a particular efficient frontier test point or select Show all test points (Best solutions only) to show data for all test points. If you select this setting, the following changes occur:
The grid changes to show a list of the best solutions, one for each test point.
The Rank column changes to Test Point.
The value on the right side of the requirement or constraint operator changes to show a range of test points. (Reports also display this range.)
The number of display solutions in the upper -right corner of the window displays the number of test points.
When you make your choices, statistics are calculated in the four rows at the bottom: the minimum, mean, maximum, and standard deviation values for all columns according to your display selections.
You can click the – or + next to a column heading to condense sections and show more columns onscreen. You can also click in a heading to sort that heading. A small triangle is displayed. You can click it to sort the column in ascending or descending order.
