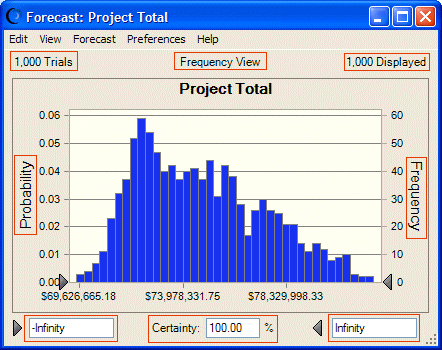
 To display a forecast chart for Strategic Finance output data, select Analyze, and then Forecast Charts.
Note: | In Microsoft Excel 2007 or later, select Analyze, then View Charts, and then Forecast Charts. |
The forecast chart plots a frequency distribution of possible output values based on bins (group intervals). As Crystal Ball EPM generates the forecast values, the number of values in each interval increases. The frequency count for all intervals yields a frequency distribution.
The following information is displayed in a forecast chart:
Trials and displayed values—The number of trials in the simulation is displayed above the Probability axis of the forecast chart. The number of trials that fall within the display range is displayed above the Frequency axis of the forecast chart.
In Figure 1, there are 1,000 trials in the simulation and 1,000 trials that fall within the display range.
View—Forecast information plotted in different ways or displayed as tables of forecast data. Split View displays two views side by side; for example, frequency and statistics. Frequency View is the default view for forecast charts.
Probability—The number of values in each group interval as a fraction of the total. In forecast charts, probability is displayed along the first vertical axis.
Frequency—The number of times a value occurs in a bin or group interval. In forecast charts, frequency is displayed along the second vertical axis.
Display Range—Forecast charts show a display range, which excludes extreme values. The endpoints for the display range appear on each end of the horizontal axis.
In Figure 1, the display range is -Infinity to +Infinity and all values are displayed.
Certainty— Calculated by comparing the number of forecasted values in the certainty range with the number of values outside the range. The certainty level appears below the forecast chart in the Certainty field, accessible with the Tab key. (See Step 5: Determine Certainty Levels.)
In Figure 1, the certainty is 100%.
Certainty Range—The linear distance for the set of values between the end-point grabbers on a forecast chart. (See Step 5: Determine Certainty Levels.)
 Click here for Step 5: Determine Certainty Levels.
