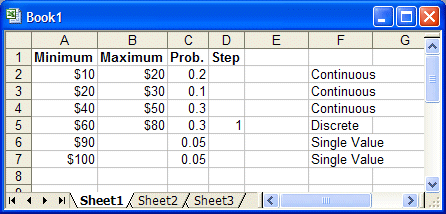
In this example, a company decides that the unit cost of a new product can vary widely. The company feels it has a 20% chance of being any number between $10 and $20, a 10% chance of being any number between $20 and $30, a 30% chance of being any number between $40 and $50, a 30% chance of being a whole dollar amount between $60 and $80, and there is a 5% chance the value will be either $90 or $100. All the values have been entered on the worksheet in this order: range minimum value, range maximum value (for all but Single Value ranges), total probability, and step (for the Discrete Range only) as shown in Figure 100, Four-column Custom Data Range.
So, you can create an assumption, select Custom Distribution, and then select Parameters, and then Discrete Ranges before loading the data.
 To complete the data load:
Create an assumption, select Custom Distribution, and then select Parameters, and then Discrete Ranges before loading the data.
In this example, discrete ranges have the most parameters. so that parameter setting was selected. If the data also included discrete sloping ranges, you could select Parameters, and then Sloping Ranges before loading the data. The data table would then have five columns and could accommodate all data types.
Click the More button to expand the Define Assumption dialog and include a data table.
Since the values are already on the worksheet, you can click Load Data to enter them into the Custom Distribution dialog.
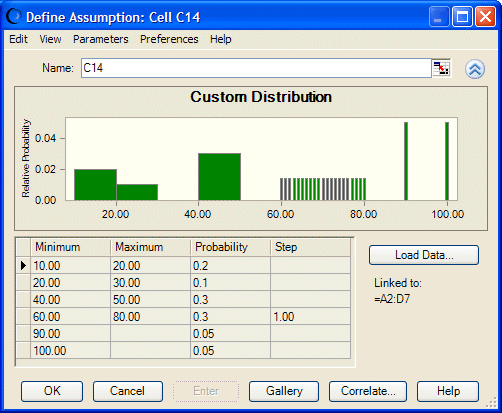
Crystal Ball enters the values from the specified range into the custom distribution and plots the specified ranges, as shown in Figure 101, Custom Data from Worksheet.
For more additional examples, see the probability distribution information in the Oracle Crystal Ball Reference and Examples Guide.

