So far, Vision Research has spent $10,000,000 developing ClearView and expects to spend an additional $3,000,000 to $5,000,000 to test it based on the cost of previous tests. For this variable, “testing costs,” Vision Research thinks that any value between $3,000,000 and $5,000,000 has an equal chance of being the actual cost of testing.
The uniform distribution describes a situation where all values between the minimum and maximum values are equally likely to occur, so this distribution best describes the cost of testing ClearView.
 To define the assumption cell for testing costs:
Select Define, and then Define Assumption.

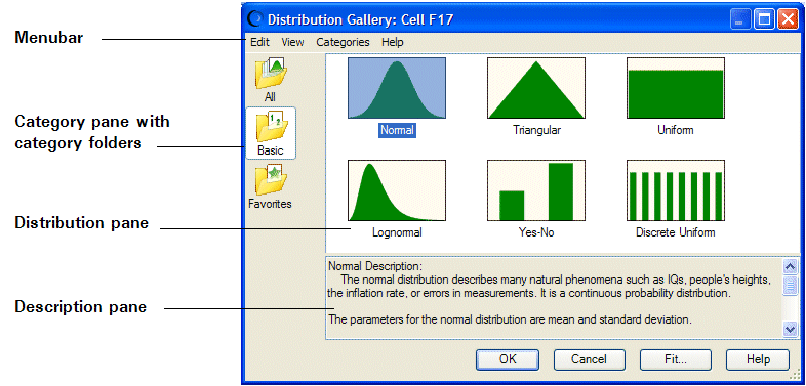
Because an assumption has not yet been defined in cell C5, the Distribution Gallery dialog opens as shown in Figure 116, Distribution Gallery Dialog.
By default, the Basic distributions are displayed. These are six of the most frequently used continuous and discrete distributions. When you click a distribution to select it, information about that distribution is displayed at the bottom of the Distribution Gallery.
In Microsoft Excel 2007 or later, if you click the upper half of the Define Assumption icon or if the assumption has already been defined, the Distribution Gallery opens. If you click the lower half of the Define Assumption icon, a list of All, Basic, or Favorite distributions opens, depending on the active category in the Distribution Gallery.
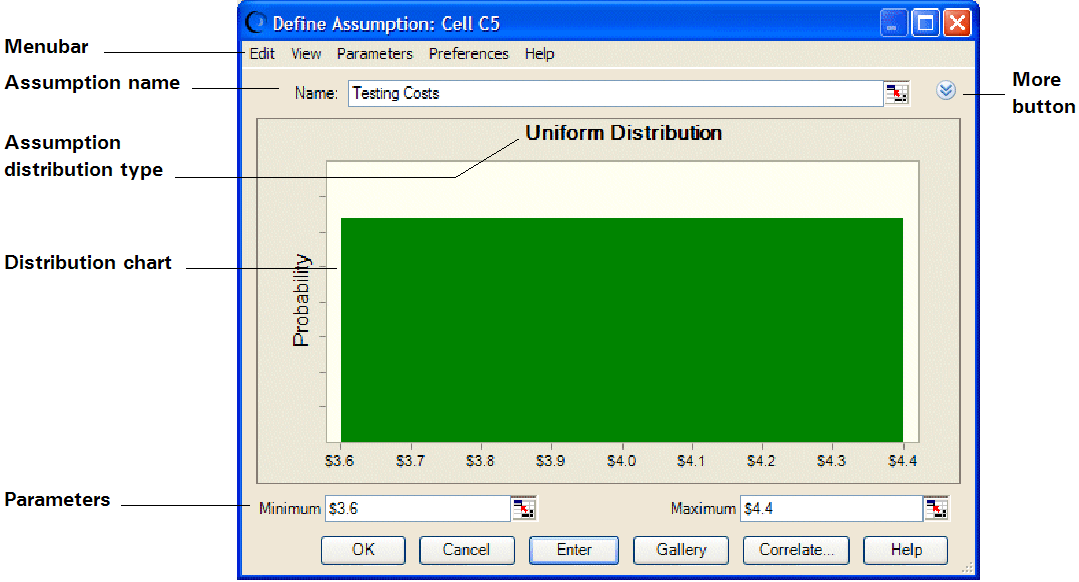
The Uniform Distribution dialog opens (Figure 117, Uniform Distribution for C5).
Since cell C5 already has label text beside it on the worksheet, that text is displayed in the Assumption Name text box. Use this name, rather than typing a new one. Also, notice that Crystal Ball assigns default values to the distribution parameters, Minimum and Maximum.
Vision Research expects to spend a minimum of $3,000,000 and a maximum of $5,000,000 on testing. Use these values in place of the defaults to specify the parameters of the uniform distribution in Crystal Ball, as described in the following steps.
 To specify parameters:
Type 3 in the Minimum text box (remember that the numbers on the worksheet represent millions of dollars).
This represents $3,000,000, the minimum amount Vision Research estimates for testing costs.
Type 5 in the Maximum text box.
This represents $5,000,000, the maximum estimate for testing costs.
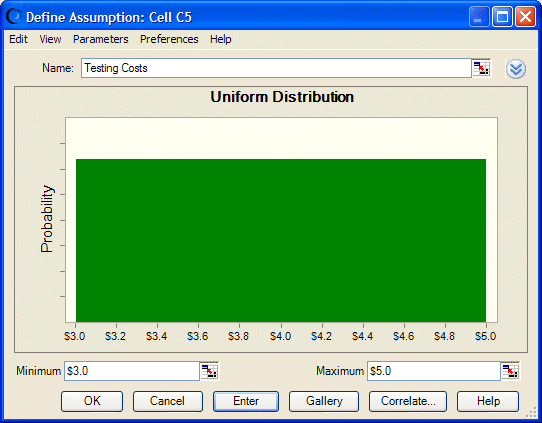
The distribution changes to reflect the values you entered, as shown in Figure 118, Changed Distribution Values.
With the values from step 1 and step 3 entered correctly, the distribution looks like Figure 118, Changed Distribution Values. Later, when you run the simulation, Crystal Ball generates random values for cell C5 that are evenly spread between 3 and 5 million dollars.


