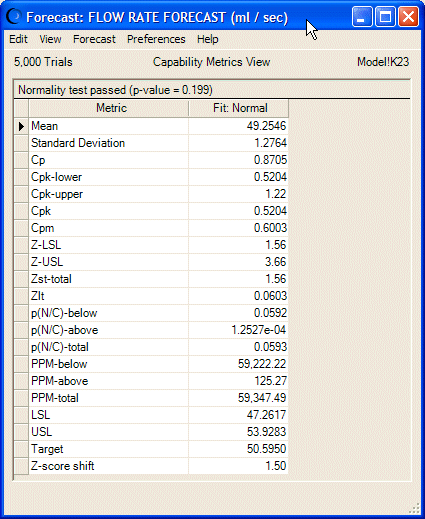
After you have defined a forecast with at least one specification limit (and, optionally, a target), you can run a simulation and display capability metrics for the forecast.
 To display capability metrics:
Define a forecast with LSL, USL, and Target values as described in Setting Specification Limits and Targets.
In the forecast window, select View, and then Capability Metrics.
A table of metrics opens, similar to Figure 134, Capability Metrics View.
For a description of each statistic, see the capability metrics list in the Oracle Crystal Ball Reference and Examples Guide.
It can be helpful to view a forecast chart and its capability metrics side by side in Split View. This is now the default view when capability metrics are activated. For instructions, see Using Split View.
