You can fit distributions to forecasts in overlay charts two ways:
Select Overlay, and then Fit Probability Distributions in the overlay chart menu bar to do a quick fit with the default or currently selected distributions and ranking method. You can also use this command to switch off distribution fitting that is set with either the Overlay menu or Preferences menu.
Select Preferences, then Overlay, and then Overlay Window in the overlay chart menu bar to specify particular distributions and to select one of three fit ranking methods. Then, you can also change the fit options or use Apply To to set these preferences for other overlay charts.
 To fit a probability distribution to all forecasts in an overlay chart using the Preferences menu:
Follow the steps for forecast charts given in Fitting a Distribution to a Forecast. Wherever the instructions say Forecast, as in Preferences, and then Forecast, substitute Overlay.
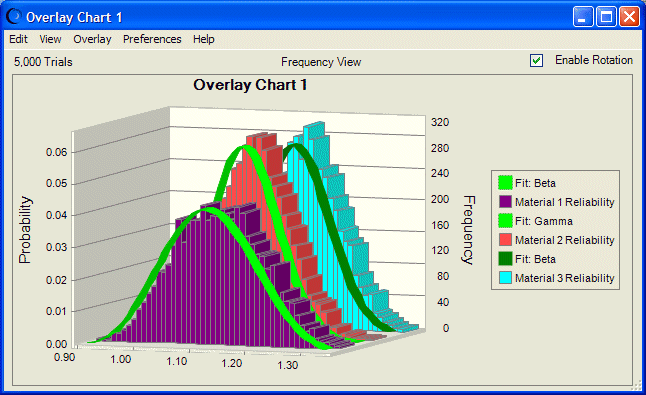
Crystal Ball fits the distributions, and then displays a probability distribution for each forecast as shown in Figure 34, Overlay Chart with Forecasts and Lines of Best Fit. As the legend shows, the forecast in the middle fits best to a gamma distribution, while the other two are beta fits. The Chart Type tab of the Chart Preferences dialog was used to change the colors of the lines of best fit for greater contrast in the figure.
Note:
This overlay chart is shown in 3D, rotated view with legend to the right.
