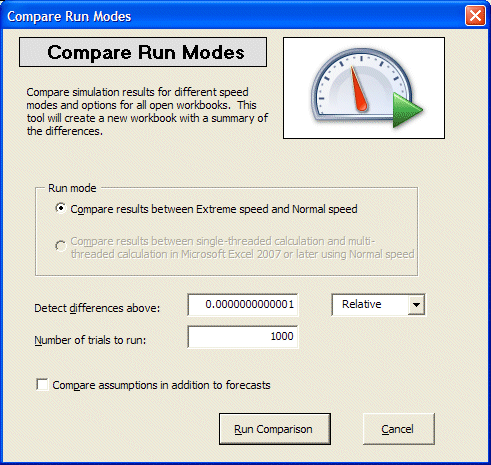
If you are concerned about possible differences in model calculations between Extreme and Normal speed in Crystal Ball Decision Optimizer, the Compare Run Modes tool enables you to compare the results between the two run modes.
 To use the Compare Run Modes tool:
Select Run, then More Tools, and then Compare Run Modes.
The Compare Run Modes dialog opens.
If you are using Crystal Ball with Microsoft Excel 2007 or later, select whether to compare results between Extreme and Normal speed or between single-threaded calculation and multithreaded calculation.
Indicate the amount of difference to detect, whether that difference is absolute or relative, and the number of trials to run. Optionally, select whether to compare assumptions as well as forecasts.
Depending on the size of the model, differences may not become obvious until after a fairly large number of trials have run. You may want to run 5,000 or more trials for the test.
When you are ready, click Run Comparison.
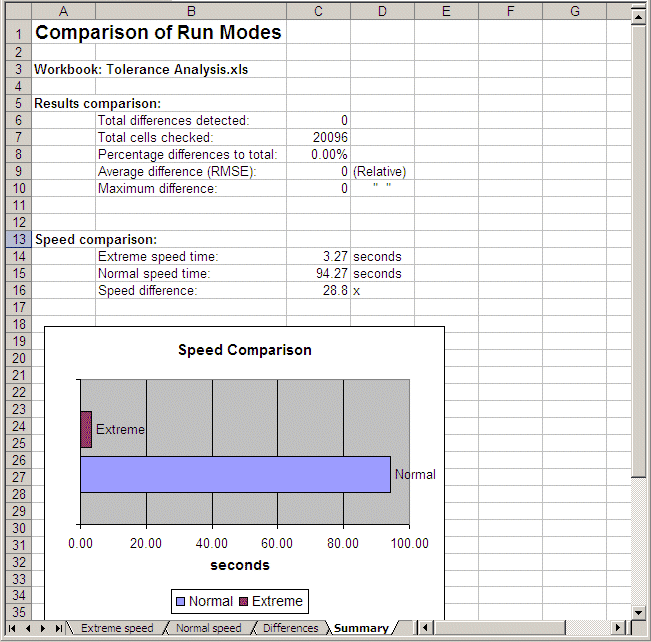
If you are comparing speed results, the simulation runs once in Extreme speed and once in Normal speed. Otherwise, the simulation runs once with single-threaded and once with multithreaded calculations. Results are displayed in a new workbook. The comparison Summary tab is displayed when the comparison is complete.
Figure 77, Comparison results for Tolerance Analysis.xls, 5,000 Trials shows comparison results for the Tolerance Analysis.xls example file with 5,000 trials. In this case there were no differences in results and the model ran 28.8 times faster in Extreme speed.
Note: | Because of variations in the random number seeds, you may see differences in comparison results if you use Microsoft Excel’s RAND or Crystal Ball’s probability functions (such as CB.Uniform) in the model. |

