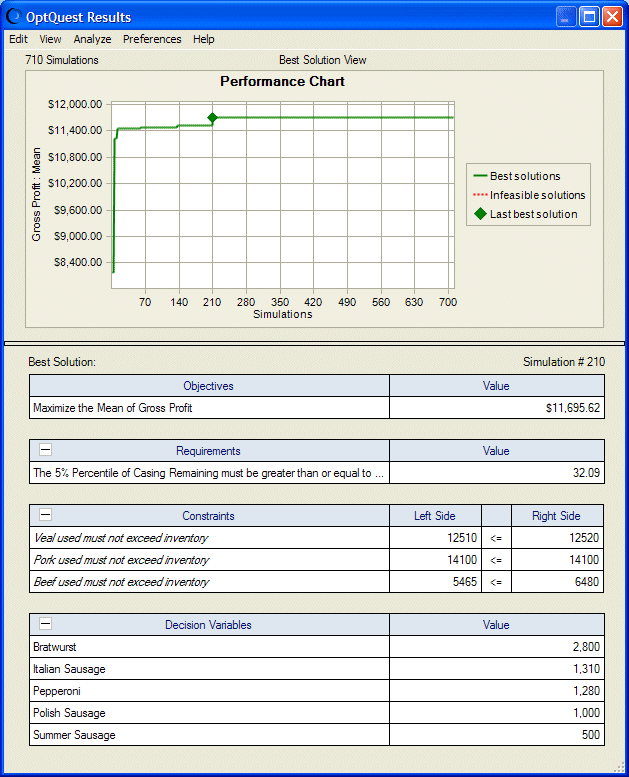
Figure 8, OptQuest Results Window, Best Solution View shows Best Solution view results for an OptQuest example model, Product Mix.xls.
In the Best Solution view, the OptQuest Results window shows a performance chart plotting best solutions found during analysis. It also shows the single best solution found for the objective, any requirements, any constraints, and all included decision variables.
The performance chart displays the trajectory of the search; that is, the rate at which the best objective value has changed during the course of the search. This is shown as a plot of the best objective values as a function of the number of simulations (solutions). If any requirements have been specified, the line may initially be red, indicating that the corresponding solutions are not feasible according to the requirements. A green line indicates feasible solutions.
Once OptQuest finds a feasible solution, it is common for this line to show an exponential decay form (for minimization), where most improvements occur early in the search.
Each time OptQuest identifies a better solution (closer to feasibility or with a better objective) during the optimization, it plots new points in the performance chart and updates the tables that accompany the chart.
If you have requested an Efficient Frontier analysis, you can also display the Efficient Frontier view (Efficient Frontier Analysis).
