This example uses the Crystal Ball Decision Optimizer sample file named Product Mix.xls. If you open it, start OptQuest, and then select Constraints, the Constraints panel is displayed (Figure 3, Constraints Panel for the Product Mix Example File).
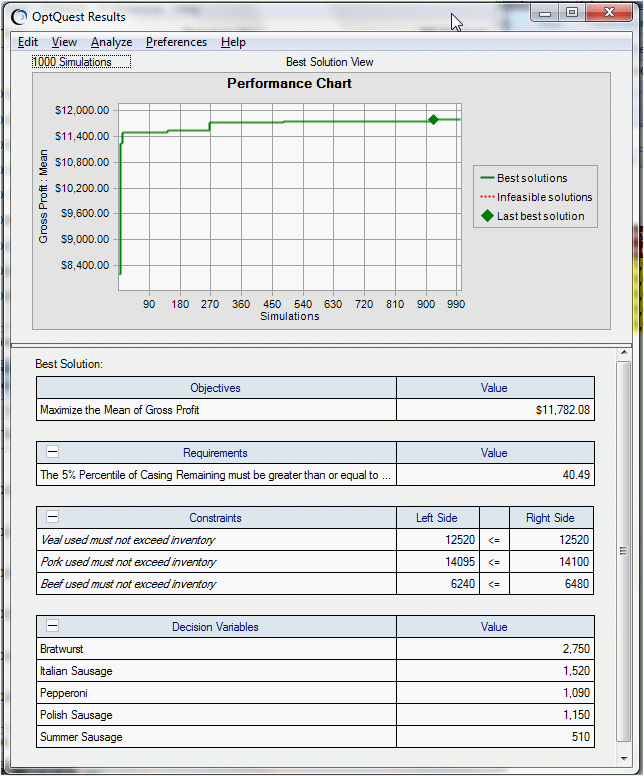
For each of three types of meat (veal, pork, and beef), there is a Microsoft Excel SUMPRODUCT formula that multiplies each of five products (in pounds) times a production quantity and then states that the amount produced must be equal to or less than an Inventory On Hand amount. An objective and requirement further limit the problem, as shown in the OptQuest Results window (Figure 4, Product Mix Results with Default Constraints). Notice that comments are used to label the constraints.
To use bulk constraints, the SUMPRODUCT formulas are placed in cells C23, D23, and E23 with inventory on hand in cells C14, D14, and E14. For example, cell C23 contains =SUMPRODUCT(Model!C6:C10, Model!H6:H10). The constraint formula is rewritten to reference those cells (Figure 5, Three Constraints Rewritten as One Bulk Constraint Formula).
Figure 6, Product Mix Results with Bulk Constraints Formula shows results with the constraint formula illustrated in Figure 5, Three Constraints Rewritten as One Bulk Constraint Formula. Because the same seed value was used for both optimizations, the results are the same. Notice how separate results are displayed for each of the constraint formulas, even though they were originally defined with one equation.


