 In the Options panel, you set options for controlling the optimization process. For details, click the Help button.
For this tutorial, set the maximum number of simulations to 1000.
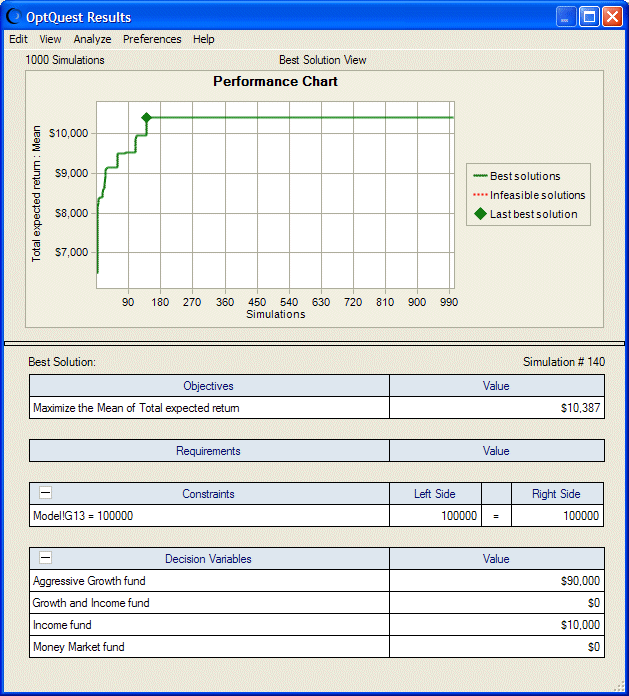
The OptQuest Results window opens (Figure 30, OptQuest Results Window — Best Solution View, Portfolio Allocation Model). It is displayed in Best Solution view, which provides an overview of the best solution found during the optimization.
The mean of the Total Expected Return forecast, $10,387, is displayed in the Objectives table. In the Decision Variables table, you can see the amount to allocate to each fund to achieve the objective: Aggressive Growth fund = $90,000; Growth and Income fund = $0; Income fund = $10,000; and Money Market fund = $0.
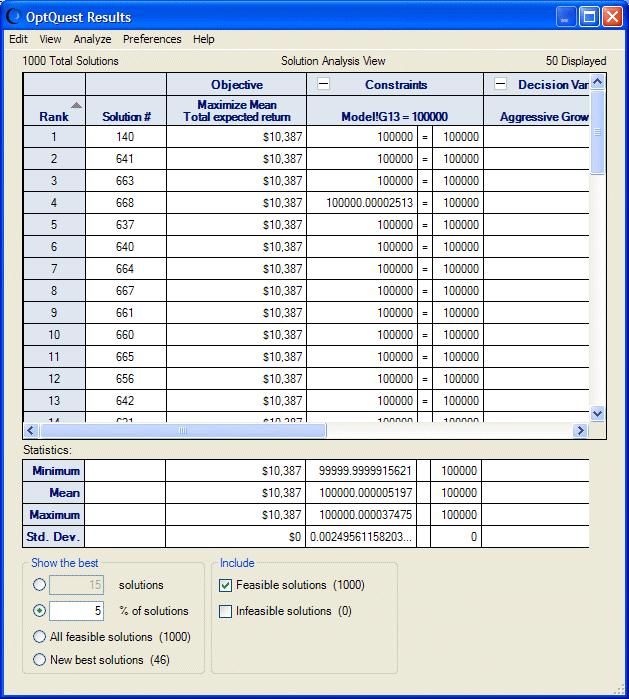
If you select View, Solution Analysis in the menubar, the Solution Analysis tables are displayed.
By default, the solutions list displays the best 5% of solutions ranked by the objective value. If you scroll the list, you can see the sets of decision variable values that OptQuest tried during its search for the best solution. You can also see the values of requirements and constraint formulas that were calculated based on these decision variables.
The statistics table below the solutions list shows the minimum, mean, maximum, and standard deviation values for the objective, the constraint, and each decision variable (the columns in the table).
In this case, the investment strategy maximized the return of the portfolio, but at a price: high risk due to high volatility and little diversification. Is this really the best strategy? To find out, the investor must interpret the results.

