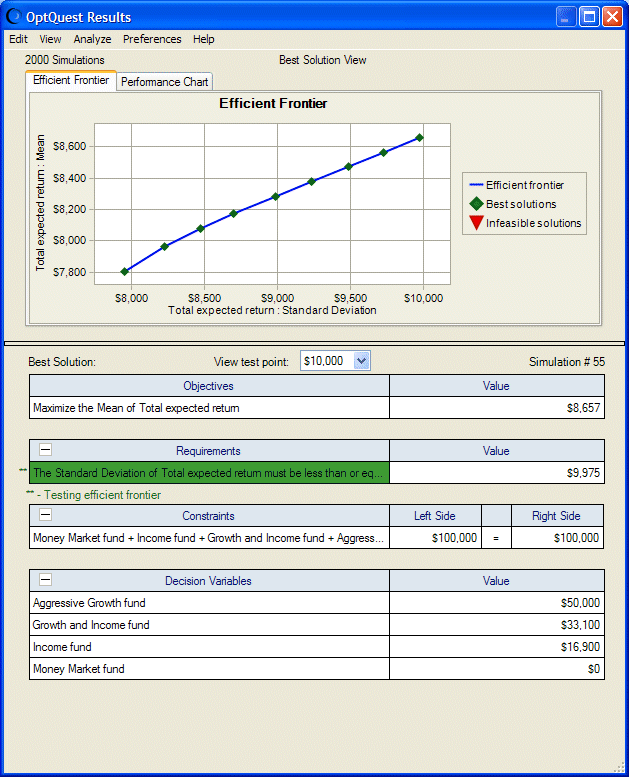
If you have entered a variable requirement for the optimization, an Efficient Frontier tab opens with the Performance Chart tab in Best Solution view (Figure 10, Efficient Frontier Chart, Best Solution View).
The Efficient Frontier window displays a plot of the objective value against the requirement or constraint that is being tested. The best solution for each test point is displayed as a green diamond in the chart. The table that accompanies the chart shows the best solution values for a specific test point. You can select which best solution to view by selecting the View Test Point drop-down menu or by clicking the diamond symbol in the chart. For more information about Efficient Frontier analysis, see Setting Up Efficient Frontier Analysis in OptQuest.
