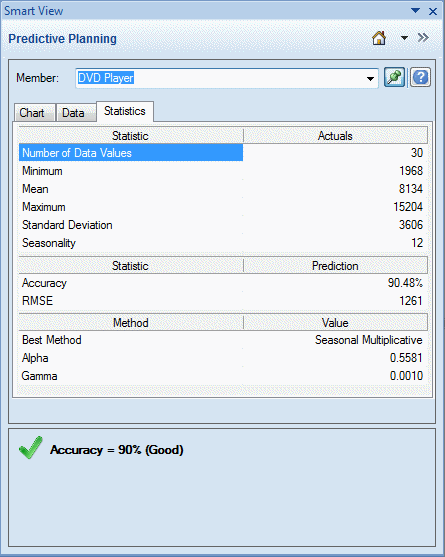
The Statistics tab shows several statistics about historical data used to generate the prediction: number of values, minimum value, mean value, maximum value, standard deviation, and the period of seasonality if present (Figure 5, Predictive Planning Panel, Statistics Tab).
Number of data values—The number of historical data values in the date range
Minimum—The smallest value in the date range
Mean—The average of a set of values, found by adding the values and dividing their sum by the number of values
Maximum—The largest value in the data range
Standard deviation—The square root of the variance for a distribution, where variance measures the degree of difference of values from the mean
Seasonality—Whether the data has a detectable pattern (cycle) and, if so, the time period of that cycle
The table also displays the following:
An accuracy value (calculated by subtracting the mean absolute percentage error, MAPE, from 100%)
The current error measure used to select the best time-series forecasting method (the default is root mean squared error, RMSE); see Time-series Forecasting Accuracy Measures for a list.
The name of the best time-series forecasting method (Classic Time-series Forecasting, ARIMA Time-series Forecasting Methods)
The parameters for that method (Classic Nonseasonal Forecasting Method Parameters, Classic Seasonal Forecasting Method Parameters)
For more information about accuracy, see Summary Area and Comments.
