You can paste the forecasted results into the spreadsheet for further analysis using Oracle Crystal Ball or Microsoft Excel.
 To paste forecasted results:
In the Paste Forecasts to Spreadsheet dialog:
Select At end of historical data to indicate where to paste results.
Select Include date series to list dates in the first column.
Select Paste forecasts as Crystal Ball assumptions.
Confirm that AutoFormat is selected.
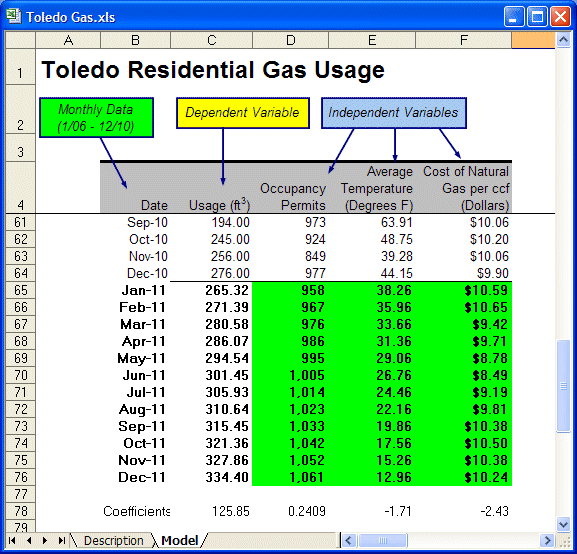
Look at the results pasted below the historical data (Figure 16, Gas Service Predictions for the Next Twelve Months).
The upper spreadsheet pane was frozen below the column headers to display them in this figure.
In Figure 16, Gas Service Predictions for the Next Twelve Months, notice that:
Forecasted results for 12 months are pasted at the end of the historical data.
The independent variables have been defined as Crystal Ball assumptions. These assumptions are defined as normal distributions with a mean equal to the cell value.
The dependent variable (Usage) column contains the regression equation that references the independent variable forecast values.
The Coefficients row below the pasted forecasts contains the regression coefficients referenced in the dependent variable regression equations.
