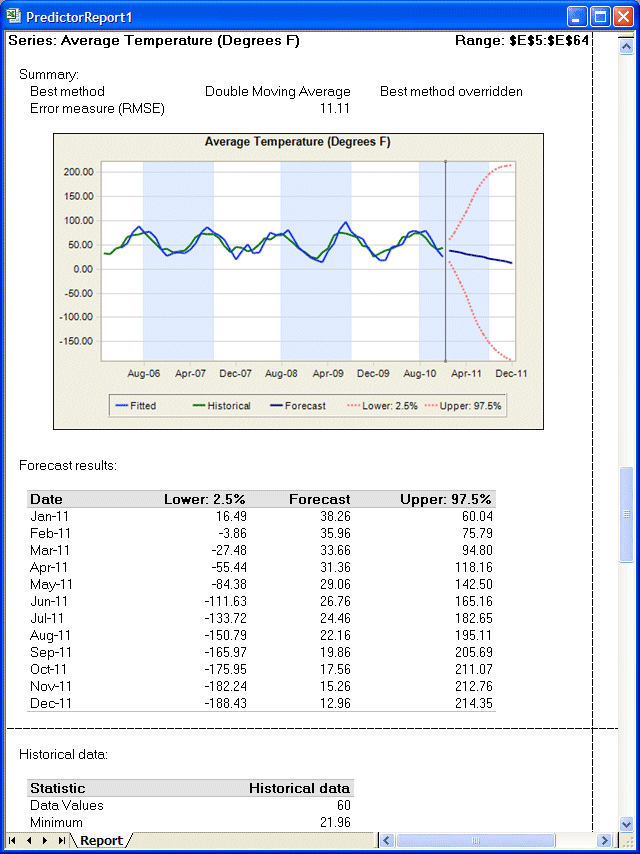
 To create a report of Predictor data for each series:
Display the Predictor Results window.
If it is not visible, click Predictor Results in the Windows task bar. (It may be in the Microsoft Office Excel group.)
In the Predictor Results window menu bar, select Analyze, and then Create Report.
In the Create Report Preferences dialog, confirm that Predictor is selected and then click OK.
By default, the report is created in a separate workbook. The report contains summary data followed by information for each dependent and independent variable.
Click the Report workbook and scroll to the Average Temperature section (Figure 17, Average Temperature Data Report for Toledo Gas).
Notice the indication above the chart that the method used was an override of the best method.
