In portfolio management, controlling the variability of the solution to minimize risk can be just as important as achieving large expected returns. Suppose that this same investor wants to reduce the uncertainty of returns for the portfolio, while still attempting to maximize the expected return. You may want to find the best solution for which the standard deviation is much lower, say, below $8,000.
You can edit the OptQuest settings to add this risk limitation and still maximize the total expected return.
 To edit OptQuest:
With Portfolio Allocation.xls open and settings as described previously in this tutorial, select Run, and then OptQuest. If you just ran an optimization, click Reset in the OptQuest Control Panel. When the Reset prompt is displayed, select Launch OptQuest Wizard and click Yes.
Optional: If it is not already open, click Objectives in the navigation pane of the OptQuest wizard.
The panel opens with Maximize the Mean of Total Expected Return listed as the objective.
In the new row, click Mean. In the list, select Standard Deviation.
Click greater than or equal to and change it to less than or equal to.
Then, click 100 and change it to 8000.
This adds a requirement that the standard deviation of the expected returns must be less than or equal to $8,000 for a solution to be considered feasible.
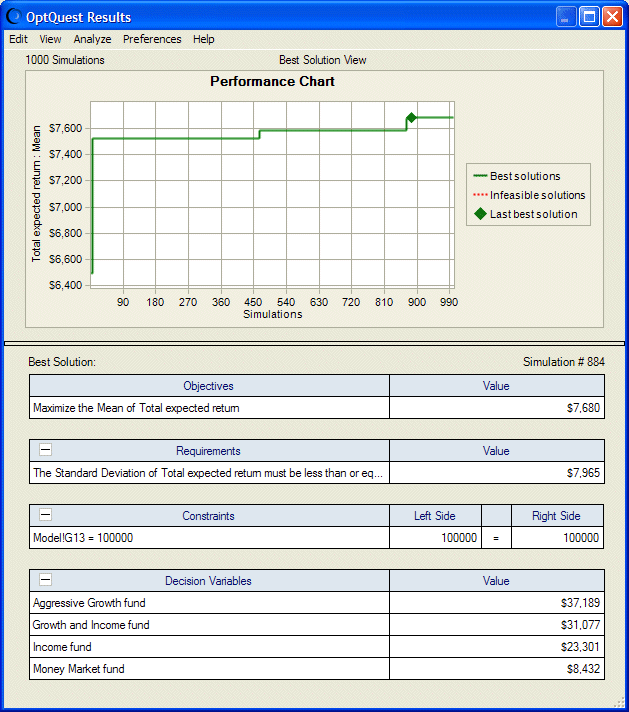
The new results are shown in Figure 34, Portfolio Allocation Optimization Results with Risk.
As shown in Figure 34, Portfolio Allocation Optimization Results with Risk, after several hundred simulations, OptQuest found a solution that meets the requirement well. The standard deviation of Total Expected Return is just below $8,000. The objective value, though, is now significantly lower than the previous solution without the limit on risk (Figure 30, OptQuest Results Window — Best Solution View, Portfolio Allocation Model).
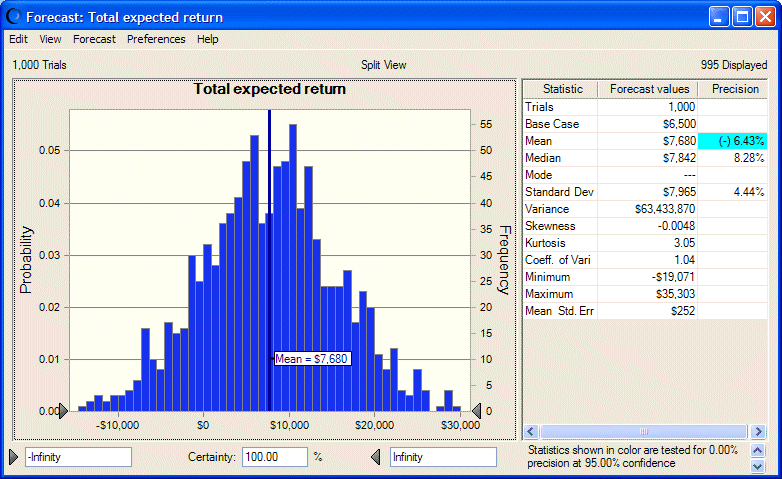
If you return to the Portfolio Allocation model and display the resulting forecast chart in Split View (Figure 35, Best Optimization Solution with Lower Risk Requirement), you can see that the new values are displayed. The standard deviation of Total Expected Return is just less than $8,000 and the coefficient of variability is slightly greater than 1.


