 Use the following steps to start OptQuest and optimize the Futura Apartments model.
To start OptQuest select Run, and then OptQuest, or click
 .
.If this is the first time you have run OptQuest, the OptQuest Welcome panel opens. Otherwise, the Objectives panel opens.
Optional: If the Welcome panel opens, click Next.
The Objectives panel opens (Figure 17, Objectives Panel, Futura with OptQuest Example).
The objective for this example is to maximize the mean of the Profit or Loss forecast.
To define an objective, click Add Objective. (For this example, the objective has already been added.) A default objective is displayed in the Objectives list:
Maximize the Mean of Profit or Loss
This is the wanted objective, so no further editing is necessary.
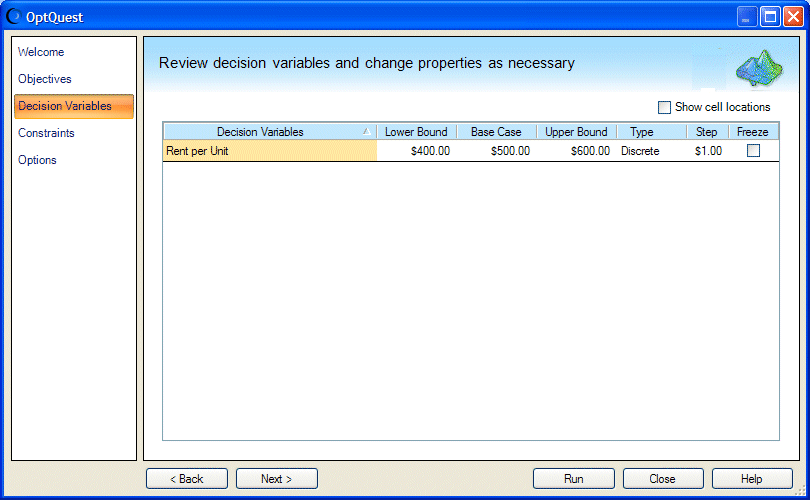
The Decision Variables panel opens, as shown in Figure 18, Decision Variables Panel, Futura with OptQuest Example.
The Decision Variables panel shows one decision variable, Rent Per Unit.
The lower bound on the variable is 400, the upper bound is 600, and the base case is 500 (the current value in the worksheet). The variable type is listed as Discrete. Because Freeze is not selected, this decision variable will be included in the OptQuest simulation.
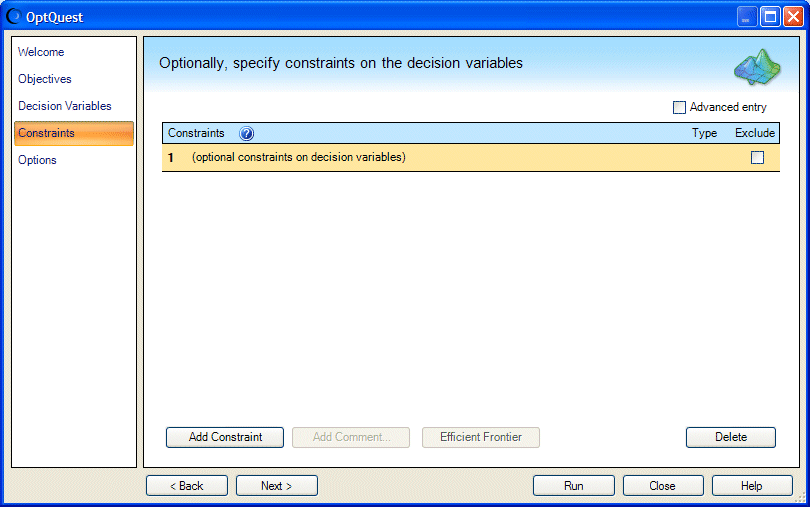
The Constraints panel opens, as shown in Figure 19, Constraints Panel, Futura with OptQuest Example.
This example has no constraints on the decision variables, so do not add any here.
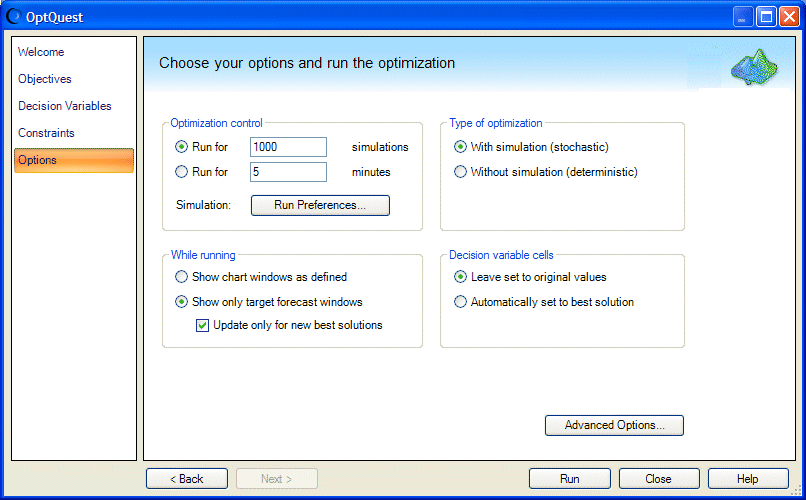
Click Run in the Options panel.
OptQuest systematically searches among the set of feasible solutions for ones that improve the mean value of the Profit Or Loss forecast.
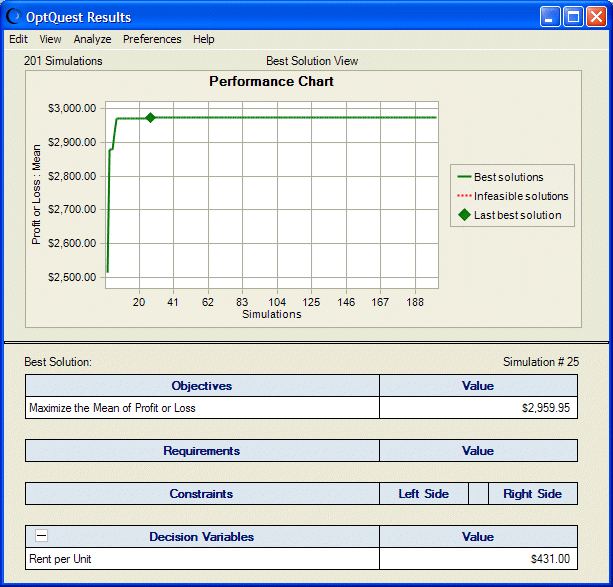
In a short time, OptQuest finds the best solution and displays the OptQuest Results window (Figure 21, OptQuest Results for Futura Apartments Model).
The performance chart shows solutions calculated by OptQuest. Numeric results are displayed in the table below the chart. For this optimization, the best solution was found at simulation 25. The optimum rent of $431 per unit produced a maximum mean expected profit of $2,959.95.
As you requested in the Options panel, a forecast chart for the best solution is displayed. If you select View, Statistics in the forecast chart menubar, you can see that the mean of the displayed forecast distribution is equal to the maximum mean expected profit shown in the OptQuest Results window ($2,959.95).
Select Edit, and then Copy Best Solution to Spreadsheet in the OptQuest Results window menu bar.
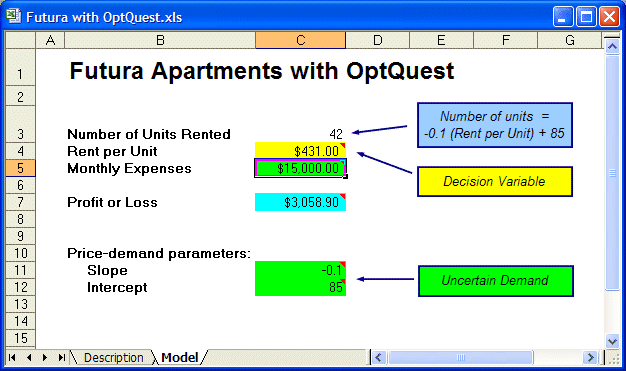
If you look at the Futura with OptQuest workbook, you can see that cell C4, the decision variable, is now set to the Rent per Unit value that OptQuest calculated, $431. The spreadsheet holds deterministic calculations based on the optimal value of the decision variable. Because cells C3 and C7 contain formulas that include C4, the values of those cells have also changed, as shown in Figure 22, Futura with OptQuest Optimized for Maximum Profit. Now, you need to rent 42 units at $431 each to obtain maximum proft of about $3,059.

When you run an optimization, wizard settings are automatically saved to your workbook. For details, see Saving Optimization Models and Settings. |