As you progress through the Predictor wizard, you need to know if the data is seasonal (increases and decreases in a regular cycle) and, if so, what the season or cycle is. You can select AutoDetect in the Input Data panel, but you still may want to view charts of historical data to confirm seasonality selections before you run Predictor. In the Data Attributes panel of the Predictor wizard, you can choose to view charts of data values and autocorrelations for each series of historical data.
Note: | If you selected Fill-in missing values in the Input Data panel, the missing values are already filled in when you view charts of historical data and autocorrelations. Data counts include the filled-in values. However, if you selected Adjust outliers, these charts do not include outlier adjustments and data counts. To view adjusted data, including data counts adjusted to include outliers, select View Screened Data. |
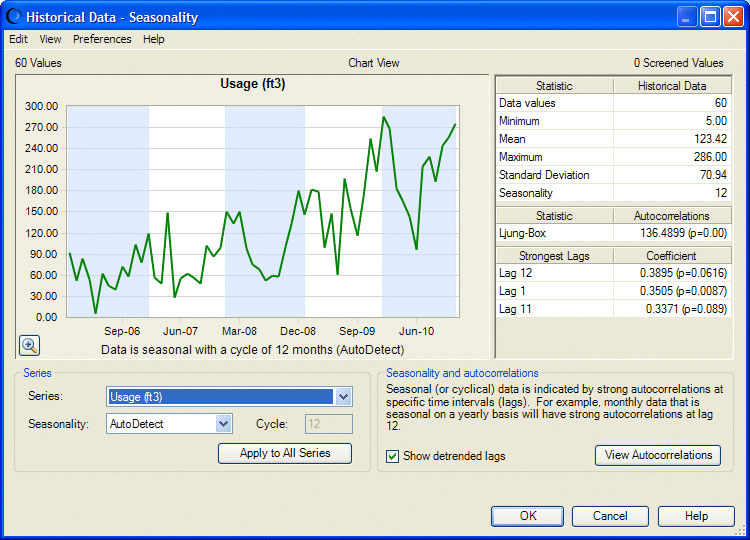
 To view historical data values by series, in Data Attributes, click View Seasonality. The Historical Data - Seasonality dialog opens (Figure 2, Historical Data – Seasonality Dialog).
Historical Data - Seasonality contains:
Series chart, upper-left corner—By default, plots historical data values for the selected series; can also display autocorrelation coefficients (see Identifying Seasonality with Autocorrelations for details). In both views, seasonality is indicated by a repeating pattern.
Series group, lower-left corner—Lists all the data series in the selected spreadsheet cell range. The currently selected series is displayed in the chart. Contains:
Series—The selected series
Seasonality—Seasonality setting for the current series
Cycle—Number of time periods in each season or cycle for the current series
Apply to All Series—Applies the current settings to all series
Statistics, upper-right corner—Lists:
Statistics for seasonal data: number of data values, minimum value, mean value, maximum value, standard deviation of values, and the number of time periods in a cycle, such as 12 months in a year
Ljung-Box statistic for evaluating autocorrelations and the probability that data is not seasonal
The three most significant autocorrelation coefficients (up to a lag of one-half of the number of data points)
Menus that enable you to perform these actions:
Copy and print the chart (Edit menu)
Switch between the historical data chart, chart of data autocorrelations, and a data table (View menu)
Show and hide statistics (View menu)
Set chart preferences (Preferences menu)
Open Predictor help (Help menu)
 To show or remove trend corrections from the chart and statistics tables, select or clear Show detrended lags.
 To confirm seasonality using autocorrelations between data at different time lags, click View Autocorrelations.
The seasonality chart changes to Autocorrelations view. For more information, see Identifying Seasonality with Autocorrelations.
Tip: | If you selected more than one historical data series, change the graph to view another data series by selecting it from the Series list. |
