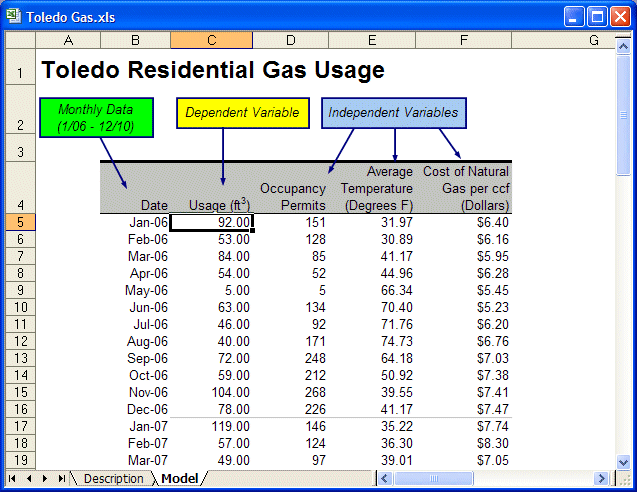
Suppose you work for Toledo Gas Company in the Residential Division. The Public Utilities Commission requires that you predict gas usage for the coming year to make sure that the company can meet the demand.
 To start the tutorial:
Start Crystal Ball, which automatically starts Microsoft Excel.
Select Help, then Crystal Ball, then Examples Guide, and then Toledo Gas in the Model Name list. (In Microsoft Excel 2007 or later, select Resources in the Help group and then select Examples Guide).
The Toledo Gas spreadsheet opens (Figure 11, Toledo Gas Spreadsheet).
Select Run, and then Predictor.
The Input Data panel opens. Predictor selected all the data from cell B4 to cell F64.
Confirm that the default settings are selected: months, AutoDetect, and Fill-in missing values. Then, click Next to open Methods.
The Methods panel offers four methods, including Multiple Linear Regression. Through research, you know that residential gas usage is primarily affected by three variables: new home starts, the temperature, and the price of natural gas. However, you are not certain how much effect each has on gas usage. Because you have independent variables affecting a dependent variable (the variable that you are interested in), regression is recommended for this forecast.
In the Toledo Gas spreadsheet, the dependent variable is the historical residential gas usage. Independent variables:
Number of occupancy permits issued (new housing completions)
Average temperature per month
Unit cost of natural gas
In Methods, confirm that all four methods are selected, and then click Multiple Linear Regression to display the Multiple Linear Regression Details pane.
Note:
Ensure that the Multiple Linear Regression check box stays selected.
Click Select Variables to open the Regression Variables dialog.
If necessary, in Regression Variables, select Usage (ft3) and use
 to move it into Dependent variables (Y's). Be sure the check box is selected, and confirm that the other three variables are listed under Independent variables (X's).
Click OK to close Regression Variables.
Methods is displayed again.
In the Multiple Linear Regression Details pane, confirm that Method is set to Standard and Include constant in regression equation is selected.
The Options panel opens with these defaults: RMSE — Root Mean Squared Error and Standard forecasting.
Click Run to run the forecast and display the Predictor Results window (Figure 12, Predictor Results Window, Toledo Gas Example).
