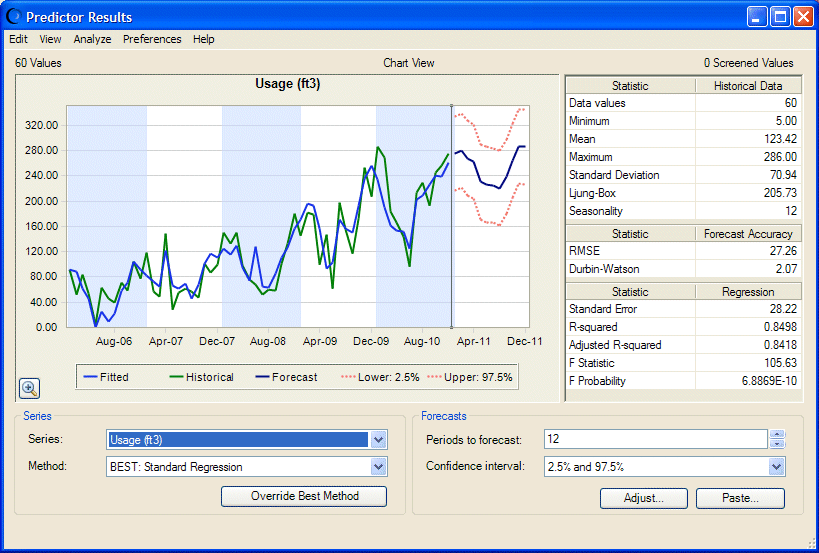
The Predictor Results window shows a chart with historical and fitted data, statistics, the name of the selected series and fitting method, the number of forecasted time periods, and the selected confidence interval. Because the data is seasonal, vertical bands are displayed in the chart to separate each season (or cycle). For more information about the Predictor Results window, see Understanding the Predictor Results Window.
 To continue with the tutorial:
Forecast the monthly usage for the next year by confirming that 12 is entered in Periods to forecast.
Notice that Confidence interval is set to 2.5% and 97.5%, the default.
Confirm that the selected Series is Usage (ft3), the dependent variable.
Notice that Method indicates that Standard Regression was selected as the best forecasting method.
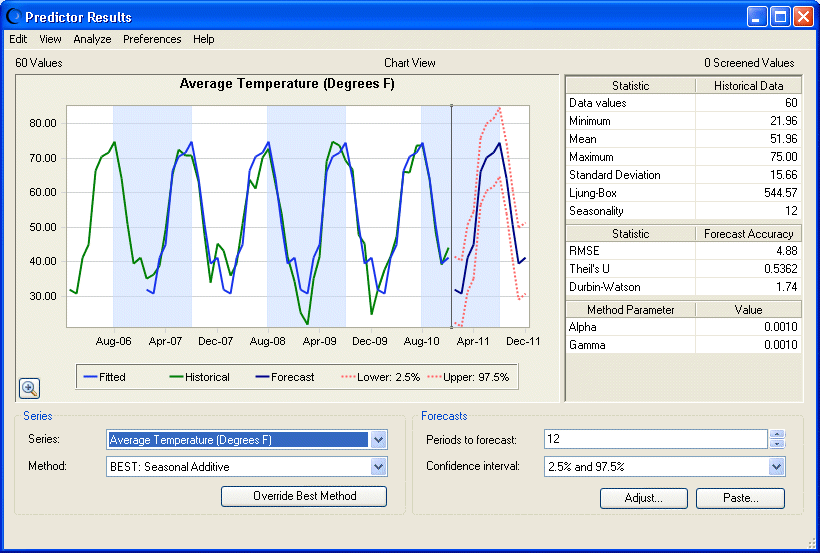
View another variable: in the Series list, select Average Temperature (Degrees F).
Forecasted values are displayed for Average Temperature. Seasonal Additive is identified as the best-fitting method (Figure 13, Average Temperature Before Method Override).
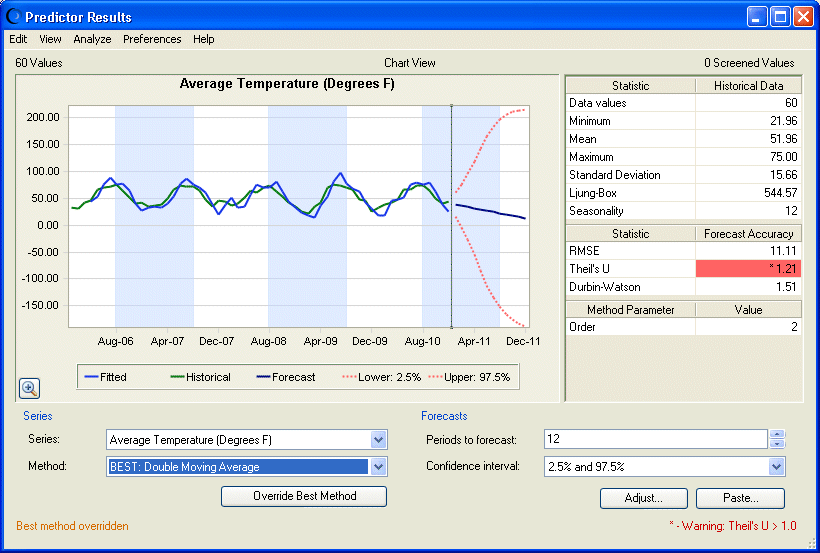
In the Method list, select Double Moving Average.
The chart changes to show the forecast using Double Moving Average instead of Seasonal Additive. A warning indicates that the Thiel's U statistic exceeds preset limits.
To experiment, click Override Best Method.
This action changes the forecast to use Double Moving Average instead of Seasonal Additive (Figure 14, Average Temperature After Method Override). A note indicates a best-method override.
The primary work of Predictor is to create forecasts based on historical data. When you override the selected forecasting method, you should carefully analyze the results.
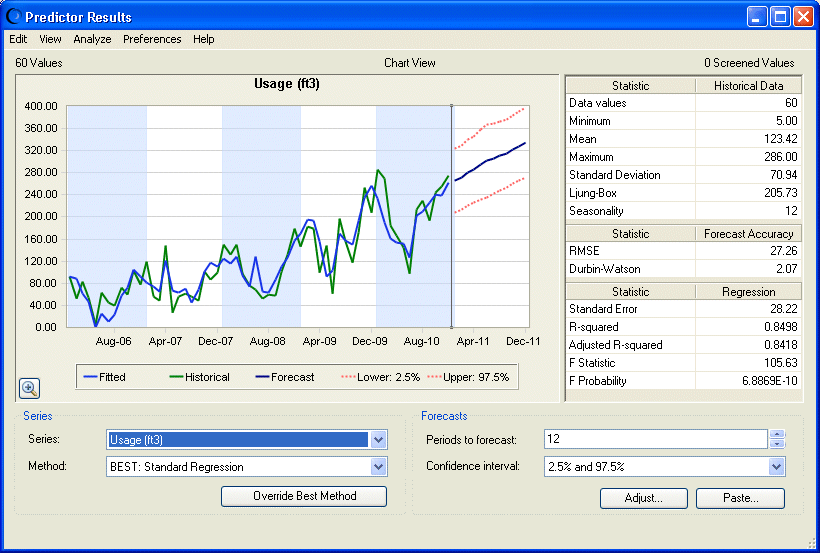
To determine the effect of this Method change on the Usage forecast, change Series back to Usage (ft3) (Figure 15, Result Window for Usage after Average Temperature Method Override).
Overriding the Average Temperature had a noticeable effect on the forecast (but not the fit) of the Usage variable. When Figure 15, Result Window for Usage after Average Temperature Method Override is compared with Figure 12, Predictor Results Window, Toledo Gas Example, you can see that the predicted results for Usage (ft3) are higher and more linear than those originally calculated.
Tip: | Unless you have a compelling reason to do so, it is better not to override the selected forecast method. |


