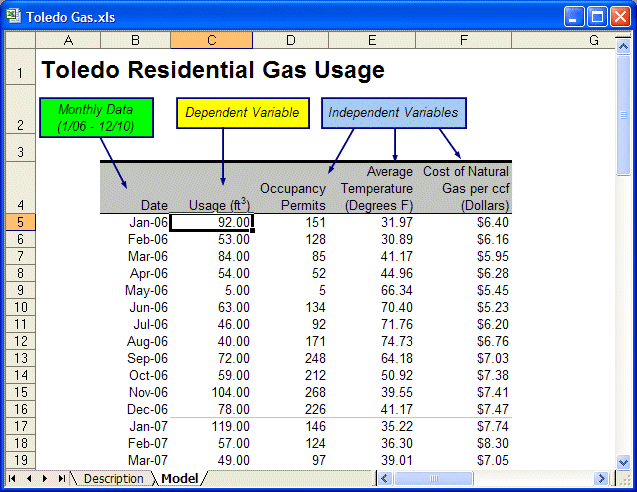
Before using Predictor, create a Microsoft Excel spreadsheet with historical data to analyze. The spreadsheet should include:
Optional: A date (or other time period, such as Q2-2004) column or row, either at the top or along the left side of the data (in the last column before the data). If you format the dates as Microsoft Excel dates, Predictor can find the dates, extend them with the forecasted values, and use them as chart labels.
Historical data, spaced equal time periods apart, in columns or rows adjacent to the date column or row. To produce a reasonable forecast, you should have at least six historical data points. Other requirements:
Single moving average analysis requires that the number of historical data points be twice the number of points to forecast.
Double moving average analysis requires that the number of historical data points be three times the number of points to forecast (or at least six, whichever is higher).
To use seasonal methods, you must have at least two seasons (complete cycles) of historical data.
For multiple linear regression, the number of historical data points must be greater than or equal to the number of independent variables (counting the included constant as an independent variable).
To lag an independent variable in multiple linear regression, lag must be less than the number of historical data points. For details on lags, see Notes about Autocorrelations.
For multiple linear regression with lags, the number of data points minus any lags and leading blanks must be greater than the number of independent variables, plus 1 if a constant is included in the regression equation.
When values in the date series are not in Microsoft Excel date format, the intervals between the values must all be exactly the same. For example, you can use integers for weeks (1, 2, 3, and so on) but you cannot omit any. The following is not an acceptable data series: 1, 2, 3, 5, 7. Also consider the valid date series 01-Jan, 01-Feb, 01-Mar. This is no longer valid when converted into days expressed as integers: 1, 32, 60.
Optional: Headings for each data column or row, such as SKU 23442, Gas Usage, or Interest Rate.
The Toledo Gas spreadsheet (Figure 1, Example Spreadsheet) has all these components.
