Note: | This section describes non-seasonal and seasonal time-series forecasting methods that do not include Box-Jenkins ARIMA methods. For information on those methods, see Using ARIMA Time-series Forecasting Methods. |
You can forecast historical data using many different time-series forecasting methods. Some methods are designed to work best for certain types of data:
Seasonal data (increasing or decreasing in a regularly recurring pattern over time; Figure 5, Seasonal Data (Left) and Data with a Trend (Right), left side)
Trend data (consistently increasing or decreasing over time; Figure 5, Seasonal Data (Left) and Data with a Trend (Right), right side)
Data with no trend or seasonality
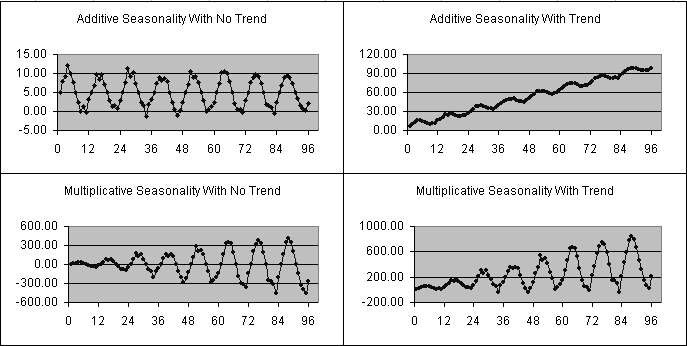
In addition to these categories, two types of seasonal methods exist: additive and multiplicative. Additive seasonality has a steady pattern amplitude, and multiplicative seasonality has the pattern amplitude increasing or decreasing over time. Figure 6, Different Seasonal Curves illustrates these different curves.
For time-series forecasting, any of the classic time-series forecasting methods should work with different amounts of success. However, each method has its own purpose, as described in Table 1 and the summary paragraphs that follow it. For more information about each classic method, see the Predictor sections of the Oracle Crystal Ball Reference and Examples Guide.
Table 1. Choosing a Classic Time-series Forecasting Method
| No Trend or Seasonality | Trend Only, No Seasonality | Seasonality Only, No Trend | Both Trend and Seasonality |
|---|---|---|---|
| Single exponential smoothing | Double exponential smoothing | Seasonal additive | Holt-Winters' additive |
| Single moving average | Double moving average | Seasonal multiplicative | Holt-Winters' multiplicative |
To summarize selection guidelines:
Moving average methods—These methods help to smooth out short-term fluctuations and highlight longer-term trends or cycles. They are used when the time series does not have a trend. When the time series has a trend, using the double moving average method computes a second moving average from the original moving average to track the trend better.
Exponential smoothing methods—While the moving averages give equal weights to included values, single exponential smoothing assigns exponentially decreasing weights as the observation get older, a more reasonable approach. When a time series has a trend, double exponential smoothing is useful and is computed by smoothing the series twice.
 To determine whether you have trend or seasonal data, click View Seasonality on the Input Data panel. For details, see Viewing Historical Data by Seasonality.
Tip: | Viewing seasonality can help you decide which methods to select. However, selecting all the classic time-series forecasting methods available for either Non-seasonal Methods or Seasonal Methods does not significantly slow down the calculations unless you are forecasting thousands of values at once, so you can consider trying them all (the default). |
 For forecasting method selection procedures, see Selecting a Forecasting Method.
 To manually set the parameters for any method, see Setting Classic Time-series Forecasting Method Parameters, following.

