 Copulas and Rank Order Correlation are two ways to model and/or explain the dependence between 2 or more variables. Historically used in biology and epidemiology, copulas have gained acceptance and prominence in the financial services sector.
In this article we are going to untangle what correlation and copulas are and how they relate to each other. In order to prepare a summary overview, I had to read painfully dry material… but the results is a practical guide to understanding copulas and when you should consider them. I lay no claim to being a stats expert or mathematician… just a risk analysis professional. So my approach to this will be pragmatic. Tools used for the article and demo models are Oracle Crystal Ball 11.1.2.1. and ModelRisk Industrial 4.0
What is correlation and how do I do it?
Loading the player ...

Correlation is used to assess the strength and direction of a relationship between 2 variables. Using the linear regression method, we can derive Pearson’s correlation coefficient by getting the R, using a square root function. This is very easy to do in Excel. Alternatively you can do a CORREL() function on two arrays of data to see how they correlate. This is the equivalent to plotting the data, applying a linear trend in Excel and extracting the R2 value and applying a square root to it.
The most widely known scale-invariant measures of association are the population versions of Kendall’s tau and Spearman’s rho. Both measure a form of dependence known as concordance. (Nelsen, 2002)
Rank order methods enable the modeler to smooth out the presence of outliers by correlating the rankings of a data set instead of the values themselves… that is the relative positioning of a datapoint within its’ dataset. In Spearman’s method we correlate the ranking pairs and extract the coefficient using Pearson linear regression method.
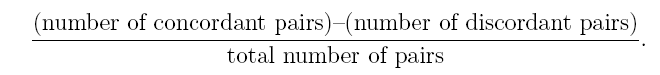
Kendall’s tau is a slightly different approach that looks at the probability of concordance minus the probability of discordance for a pair (xi, yi), (xj, yj) of observations randomly chosen from the samples. (Nelsen, 2002).
If we consider the tools, Oracle Crystal Ball, Palisade @RISK, and Risk Solver Pro use Spearman’s method to correlate two variables. They will in a sense create a very basic bivariate copula in the background to correlate two items together. This is why we get somewhat similar (but not identical) results when we compare with ModelRisk’s explicit copula correlation and the other packages.
When you want to correlate two items together in the packages above, you need to either estimate correlation or if you want to be technically correct, fit it (using Spearman, Kendall, or some other recognized method). Then, depending on the tool, you will either apply it directly in a correlation matrix OR if you are using ModelRisk, guide you to model a copula.
Working with Copulas
A copula is a function which joins or “couples” a multivariate distribution function to its one-dimensional marginal distribution functions. (Clemen & Reilly 1999, Nelsen 2002)
Generally the measuring and modeling dependencies has centered on correlation such as the ones mentioned above. Of course, it is rare for distributions to follow the strict spherical assumptions with a constant dependence across the distribution implied by correlation. (Dorey & Joubert, 2005)
For this reason, copulas have gained great prominence as a method to model these non-constant correlations. This has been a great boon to the financial engineering field for its flexibility to model these non-linear relationships.
The one thing to remember is that to build a copula, you still need to assess the degree of association in some way. Clemen and Reilly (1999) suggest 3 methods to assess correlation:
- Statistical Approaches: These techniques rely on an expert’s familiarity with statistical concepts related to correlation. For example, an expert might make a judgment regarding the “percentage of variance explained” (R2) that would result from regressing one variable on another.
- Probability Concordance is consistent with decision analysis elicitation techniques: Assess conditional or joint probabilities and relate those to the required measure of dependence.
- Conditional Fractile Estimates requires conditional estimates and uses these to derive Spearman’s r
ModelRisk is the only tool that enables you to explicitly define a copula for the purpose of modeling relationships among variables. Only the professional and industrial versions enable you to fit & rank copulas (using Information Criteria, just as when fitting distributions, see previous article) to data to extract the correct parameters.
As we mentioned earlier, in order to build a copula you need to assess the correlation or dispersion of the points using some sort of method, including Spearman’s Kendall’s tau, covariance or some other accepted method. Copulas use different parameters to define or configure the data point dispersion behavior of a copula, i.e. Alpha and Theta. There does not seem to be a method to manually derive the Alpha or Theta parameters from the data without going through the fitting tool or approximating the parameters using Spearman Correlation Coefficient. Therefore if you need to correlate using data, you will need to fit a copula using the wizard to get the parameters for a proper correlation equivalent.
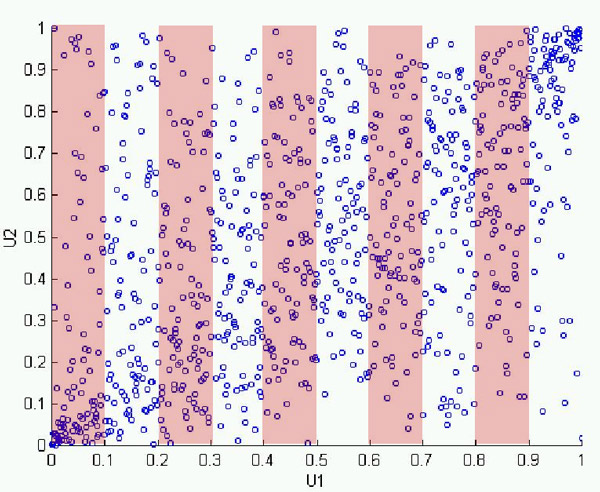
Based on our understanding, we believe that ModelRisk uses Conditional Fractile Estimates to enable the creation of non-linear & non-constant correlation patterns. In order to use this method, you need to split up your copula into bins known as fractiles (see the 10 pink and white bins in the diagram below)…. Each fractile then requires the assessment of the correlation of the points within the Fractile using either Spearman Rho or Kendall’s Tau. Of course we would need to further validate this with the people at Vose.
ModelRisk also enables you to construct bivariate copulas using distributions and correlation elicited from the risk analyst or a SME (Subject Matter Expert). This function is designed to assist risk analysts to define joint probability distributions with relative ease. Don’t forget we are talking about copulas… so relative is a very important word.
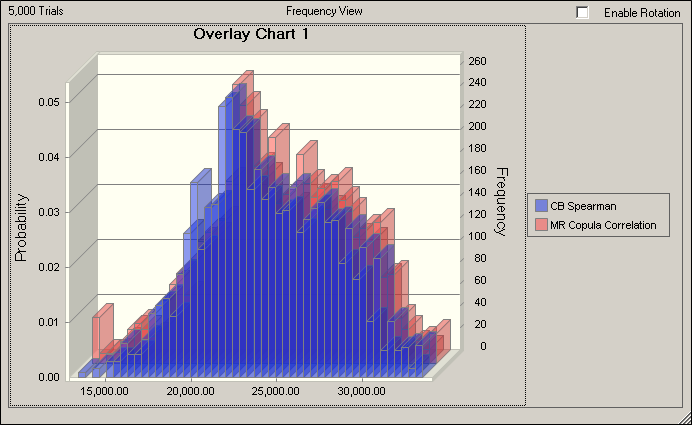
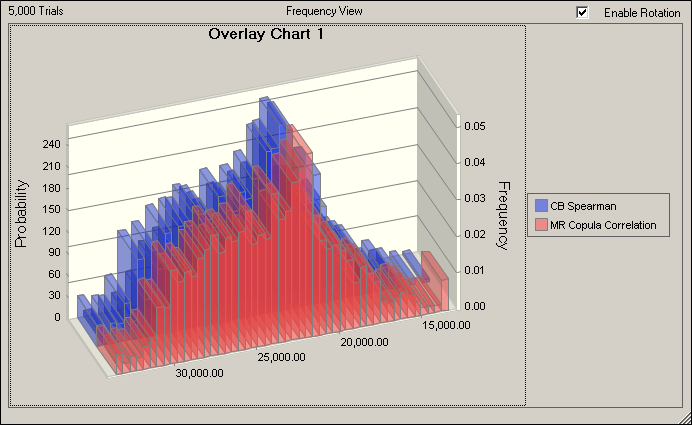
In the next section we are going to see how explicitly model copulas will differ from traditional correlation methodologies. We will compare the results in the video.
Comparing the Results of Correlation vs. Copula Models
Loading the player ...
Copulas are a very powerful and elegant way to accurately model correlation patterns – they do not assess them. One of the key reason one should serioulsy consider using copulas is when the risk in the tails is of critical importance. This is why they are used in situations where the risk in the tail is highly improbable but also highly catgastrophic, if not fatal. We generally call these coconut risks because we are aware of the consequences but due to the low probability of occurrence, we decide to accept them. A real world example is the Nuclear Plant Disaster in Fukashima, where they accepted the (deemed) low risk of water damage to their eletrical generators. This is why properly estimating risk in the tails is considered so important.

On the other hand, Copulas are not for everybody and anything because they are very mathematically intensive, therefore require lots of computing horsepower as well as an above average understanding of statistics. According to Chernih et al, (2007) "models that involve complicated copulas are by no means better than simple but robust and transparent models and do not always add value. However, building a simple as possible, but not too simple, model requires significant actuarial training and expertise."
Therefore, if the tails are not of a significant consequence in the type of modeling application you are working on, then you should consider using the traditional methods employed by the other packages for performance issues and according to Chernih et al (2007), transparency as well.
Another important consideration when deciding wether you need to work with copulas is your modeling methodology. Given that copulas use arrays, this requires you to identify upfront most if not all your model’s correlation relationships in order to structure your data and models correctly.If you do not do this you will run ito trouble in short order when implimenting your correlations.
Conversely, with the other packages, you can apply a more iterative approach for the implementation of correlation relationships.
Key Take-Aways:
- Copulas are very powerful and useful risk analysis tools.
- Copulas require an above average understanding of statistics.
- Copulas are critical in the proper modeling of the risk in the tails of an output distribution
- Copulas enable the modelin of non-linear and non-constant correlation relationships.
- Copulas require way more computing horse-power and can slow down a model quite a bit… so consider performance and accuracy wisely.
If you have any questions or comments, please don't hesitate to drop me a line at 1-888-879-8440 or send me a note at [email protected].

Article References:
- Robert T. Clemen, Reilly, Terrence "Correlations and Copulas for Decision and Risk Analysis", Management Science, Vol. 45, No. 2, February 1999, pp. 208-224
- Nelsen, R., "Properties and Applications of Copulas: A Brief Survey," Lewis and Clark College / Mount Holyoke College, 2002.
- M. Dorey, P. Joubert, "Modeling Copulas: An Overview", The Staple Inn Actuarial Society, 2007.
- Chernih, Andrew, Maj, Mateusz and Vanduffel, Steven, "Beyond Correlations: The Use and Abuse of Copulas in Economic Capital Calculations" (April 2007). Belgian Actuarial Bulletin, Vol. 7, No. 1, 2007. Available at SSRN: http://ssrn.com/abstract=1359578