 One of the cool things about professional Monte-Carlo Simulation tools is that they offer the ability to fit data. Fitting enables a modeler to condensate large data sets into representative distributions by estimating the parameters and shape of the data as well as suggest which distributions (using these estimated parameters) replicates the data set best.
Fitting data is a delicate and very math intensive process, especially when you get into larger data sets. As usual, the presence of automation has made us drop our guard on the seriousness of the process and the implications of a poorly executed fitting process/decision. The other consequence of automating distribution fitting is that the importance of sound judgment when validating and selecting fit recommendations (using the Goodness-of-fit statistics) is forsaken for blind trust in the results of a fitting tool.
Now that I have given you the caveat emptor regarding fitting, we are going to see how each tools offers the support for modelers to make the right decisions. For this reason, we have created a series of videos showing comparing how each tool is used to fit historical data to a model / spreadsheet. Our focus will be on :
The goal of this comparison is to see how each tool handles this critical modeling feature. We have not concerned ourselves with the relative precision of fitting engines because that would lead us down a rabbit hole very quickly – particularly when you want to be empirically fair.
Things to know about Goodness-of-fit
All four packages use MLE (Maximum Likelihood Estimation Calculations) to estimate distribution parameters which are then ranked using various algorithms. Crystal Ball, @Risk and Risk Solver all use the classic trio of Anderson-Darling, Kolmogorov-Smirnoff or Chi-Square.
Vose on the other-hand use Schwartz, Akaike and Hannan-Quinn information criterion models. According to Vose, the advantage of moving away from the Classic trio (AD, KS ChiSqr) is that
"Although still popular today, the Chi-Squared, Kolmogorov-Smirnoff and Anderson-Darling goodness of fit statistics are technically all inappropriate as a method of comparing fits of distributions to data. They are also limited to having precise observations and cannot incorporate censored, truncated or binned data. Realistically, most of the time we are fitting a continuous distribution to a set of precise observations and then the Anderson-Darling does a reasonable job.
For important work you should instead consider using statistical measures of fit called information criteria.
Let:
- n = number of observations (e.g. data values, frequencies)
- k = number of parameters to be estimated (e.g. the Normal distribution has 2: mu and sigma)
- Lmax = the maximized value of the log-Likelihood for the estimated model (i.e. fit the parameters by MLE and record the natural log of the Likelihood.)
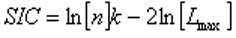
SIC (Schwarz information criterion, aka Bayesian information criterion BIC)
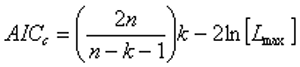
AIC (Akaike information criterion)
HQIC (Hannan-Quinn information criterion)
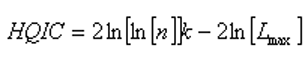
The aim is to find the model with the lowest value of the selected information criterion. The -2ln[Lmax] term appearing in each formula is an estimate of the deviance of the model fit. The coefficients for k in the first part of each formula shows the degree to which the number of model parameters is being penalised. For n > ~ 20 or so the SIC (Schwarz, 1997) is the strictest in penalizing loss of degree of freedom by having more parameters in the fitted model. For n > ~ 40 the AIC (Akaike, 1974, 1976) is the least strict of the three and the HQIC (Hannan and Quinn, 1979) holds the middle ground, or is the least penalizing for n < ~ 20." - Vose Software, 2011
- Schwartz E.S (1997). The Stochastic Behavior of Commodity Prices: Implications for Valuation and Hedging'. J Finance 52(3) Papers and Proceedings Fifty-Seventh Annual Meeting, American Finance Association, New Orleans, Louisiana January 4-6, (July 1997), 923-973.
- Akaike, 1974. A new look at the statistical model identification. IEEE Trans. Automat. Control. vAC-19. 716-723.
- Hannan, E.J. and Quin, G.G. (1979). The determination of the order of an autoregression. J.R. Statistic. Soc. B, 41, 190-195.
In this comparison, we are not going to worry about the effectiveness of the various ranking algorithms, but more on the usability and effectiveness of each tool to get the job done.
Situations where distribution fitting is very important.
The applications and uses of fitting fall essentially into two categories:
Incorporation of real data into model assumptions/inputs.
When available, modelers should try to use as much historical data as possible. Granted, the data must be analyzed and cleansed first. Examples of historical data you can fit include:
- Commodity Prices
- Time to repair or Time to failure
- Interest rates
- Inventory Levels
- Supply / Demand
- Sales Volumes
- Etc.
Model Consolidation and Execution Performance.
According to modern practice, if you need to run a large sub-model to generate an input, you can replicate the entire sub-model as a representative distribution. In sum, a sub-model can be condensed into a distribution, either parametric or non-parametric.
This has great benefits for improving the performance of large scale models because it a.) simplifies the model logic and b.) it removes a lot of moving parts, which would consume resources and increase execution time. In order to extract the parameters or fit the output of the sub-model into a distribution, distribution fitting capabilities are a necessity.
There are 4 different approaches for keeping your model fast and tidy using the best practice listed above.
|
|
Crystal Ball
|
ModelRisk Pro
|
@Risk Pro
|
Risk Solver Pro
|
|
Approach for consolidating a model.
|
Model outputs can be fitted automatically and are inserted as parametric distributions (inputs)
Inputs can be generated using the raw data into a custom distribution (ogive)
|
ModelRisk works with a different framework… they use an object model to consolidate datasets for use by Vose functions.
|
Model outputs can be fitted automatically and are inserted as parametric distributions (inputs)
|
RiskSolver Pro is able to fit outputs but there does not seem to be a way to paste them into a separate cell.
On the other hand, if you have the data, the entire set of trials is condensed into a DIST function. This is a portable approach to sharing a model output.
|
|
Dynamic fitting
|
Crystal Ball will maintain a link between the data and its non-parametric distributions.
Parametric distributions need to be refitted manually (or via macro) every time the data changes.
|
ModelRisk uses fitting objects that link into a data object (this is where the dataset is and it is represented by a formula in Excel) and refit dynamically. However if the nature of the data changes enough, you may need to refit manually anyways to ensure you are using the right fitting object.
|
@Risk Pro will automatically refit an entire dataset (range) each time the simulation is run. Very interesting feature to be used with caution for the reasons stated above.
|
None at this time
|
PART 1: Introduction and Oracle Crystal Ball 11.1.2.1. Distribution Fitting
Overall, Crystal Ball has a solid and fast data fitting tool. It is easy to use and you can import flat file from systems. We had no trouble running the tool and generating all the fits with a 150 000 points of data. I correctly picked up the data’s distribution; this would be an issue with 150k points.
Potentially, the addition of PP and QQ charts might be interesting as well as the ability to overlay multiple fits. I would also suggest that the addition of additional fitting algorithms would greatly compliment the tool.
Loading the player ...

Key Take Aways:
- Fast and effective tool
- Uses the conventional AD/KS/C2 ranking methods
- Shows all the rankings side by side and uses effective color coding to identify the best empirical fit.
- You can fit model outputs and generate distributions right from the output dialog box.
- You can maintain a dynamic link with non-parametric data (custom distributions)
|
PART 2: ModelRisk Professional 4.0 Distribution Fitting
As usual, Vose Software has staked out some unique territory with their distinctive choice of fitting methods. The tool itself is elegant and from an anecdotal perspective, quite precise with data sets that are far less than 150k. However, like in anything too much choice increases processing time. Think about how long it takes to make up your mind when your favorite restaurant has a huge menu. If you show up with a fair idea of what you are going to eat, you spend much less time thinking about what to order. Even though ModelRisk does a good job pre-selecting potential fits, be aware that a little expert judgment upfront to further filter out distributions will save processing time…
Loading the player ...
Key Take Aways:
- Very effective tool… can get bogged down fitting a few of the distributions
- Very comprehensive and information rich interface
- Uses the unconventional AIC/SIC/HQIC ranking methods
- Shows all the rankings side by side for fit comparison – color coding top ranked fits would be nice
- Objects (both data and fitting) are used to keep dynamic data fits current.
|
PART 3: Palisade @RISK Professional 5.7 Distribution Fitting
Originally Palisade sold its fitting package as a separate tool altogether known as “Best Fit”. This is a solid tool that offers most of the power and speed you would find with Crystal Ball with some added charts, including P-P and Q-Q. Where the tool would be vastly improved is in its ability to contrast or “triangulate” a proper fit. Another issue is the fact that the tool has a 100k datapoint import limit. This was more than required in the days where you had 256 columns and 64k rows. Given the ever increasing availability and quantity of data, it would make a lot of sense to tear down that barrier.
Loading the player ...
Key Take Aways:
- Fast and effective tool
- Uses the conventional AD/KS/C2 ranking methods
- Does not show the rankings side by side, forces you to try and remember who ranked where.
- You can fit model outputs and generate distributions right from the output dialog box.
- You can automatically refit a data set at the beginning of each simulation.
|
PART 4: Frontline Risk Solver Professional 11.0 Distribution Fitting
Frontline’s Risk Solver package gets the job done. They have some really nice graphics and the comparative overlay of proposed fits is cool. They are also quite innovative by incorporating DIST technology into their tool. This has a similar effect to Vose’s distribution objects. Unfortunately this will not update automatically if the data changes, but will definitely make your outputs portable.
Loading the player ...
For those who are curious about DIST functions, here is the code that resides in 1 cell:
< dist ver="1.100000" type="Double" count="39" max="1021.71" min="974.008" avg="1000.37" name="test">ixq2FI7dH8NgyJVJYvmRwP//keyNIK16igznK1ckbNfiluz0q3Jq
Hlngre+jlnbSAADH/Z9Xc8WUmb2RYFSplWb1dzV0uNj+sUpE30/cAA
Key Take Aways:
- Effective tool that seems to suffer from performance issues on large data sets. It appears that it dynamically recalcs the charts (i.e. PP or QQ)… so this becomes an issue with large data sets.
- The workflow to fit and insert the fitted distribution is a little confusing… A few explicit buttons would make it a little more intuitive.
- Uses the conventional AD/KS/C2 ranking methods
- Enables comparative overlay of fits… this is a cool feature with lots more potential.
- Does not show the rankings side by side, forces you to try and remember who ranked where.
- You can fit model outputs and generate distributions parameters right from the output dialog box but you can’t insert them elsewhere in your model.
|
PART 5: Conclusion and Comparison
With enough data, all the tools will do the job right. It’s hard to ignore Vose’s introduction of new Goodness-of-fit ranking methods – they are unique. Ranking methods notwithstanding, Performance, Speed and Information/Reporting to assess the fit should be primary considerations.
If you would like to try any of these packages, with the exception of Solver (www.solver.com), you can download them from our Downloads sections and give them a whirl. You can also download the test model and compare for yourself.

Key Take Aways:
- Crystal Ball Standard is fast, efficient and robust for distribution fitting. Their implementation of method triangulation is a really useful tool. The ability to fit output distributions or export them as non-parametric is a very useful and well implemented feature.
- ModelRisk Professional is very fast to load large data sets and has a very comprehensive & sophisticated interface. This tool requires judgment in preselecting the proper distributions, otherwise you may still be testing 50 different distributions! Dynamic fitting with objects is a nice way to keep you model up to date when the underlying data changes.
- @RISK Professional’s fitting tool is fast and seems quite robust. The ability to fit output distributions from the dialog box is nice and works well. The only unfortunate part is that it has a theoretical limit of 100k data points. For most applications this should not be an issue. Another cool feature is the ability to completely refit a dataset… as with many other things in the risk analysis world – cool, but handle with care.
- Risk Solver Professional works well and has a nice interface. Speed on large data sets is a bit of an issue. Some of the usability processes may need to be revisited but one of the usability features I do appreciate is the call-out that follows the mouse asking you where to insert your fit results.
 
Next feature on the block will be Correlation. If you have questions or suggestions for future comparisons, please don’t hesitate to call or drop me a line at [email protected]
|