Aug
25
2010
Crystal Ball utlizes several powerful functions and features to extract information and descriptive statistics. We are going to review these techniques and present the CB.GetForeStatFN in full detail, including Six Sigma Capability Metrics.
Often when we are modeling a model, we may want to monitor or focus on a particular statistic. Traditionally we always look at the statistics of the forecast of interest.
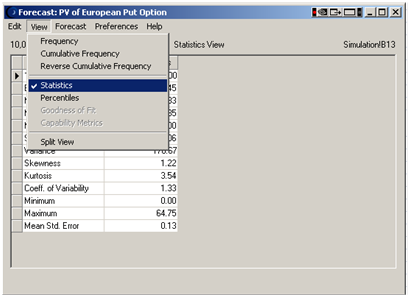
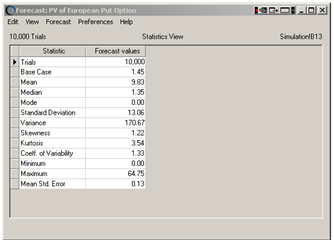
Figure 1: Viewing forecast statistics in Crystal Ball
Fortunately Crystal Ball offers several other powerful methods to extract data from a forecast:
|
Technique
|
Pros
|
Cons
|
|
Copy Stats table from forecast windows (Manual Approach)
|
- Easy
- Function is directly available from Edit Menu
|
- Data is static
- Process is manual
|
|
Auto – Extract Values from forecasts at the end of a simulation
|
- Will produce a wide array of data and descriptive statistics.
- Is easily configured in the forecast in dialog box in the Forecast Preferences
- Is visible to all non-Crystal Ball users
|
- Can overwrite portions of your model resulting in broken formulas
- Extractions are generated only when the simulation stops
|
|
CB.Get Functions (CB.GetForeFN, CB.GetForeStat)
|
- Dynamic data
- Can be used in Forecasts i.e. to see how a mean shifts
- Will produce a wide array of stats
|
- These functions tend to force CB to run in Normal speed.
- These functions are not available to non-cb users
- Will display 0 until 1 trial has been run
|
|
Crystal Ball Reports
|
- Easy to generate
- Very complete and visual
- Easy to customize
|
- Are static
- Are in a separate file
- Not designed to re-incoporate into models.
|
In this article, we will present the CB.GetForeStatFN function using the European Put Model (see Figure 2 ) developed by John Charnes for his book Financial Modeling with Crystal Ball and Excel (By the way, the model is available in the download section of this site.).
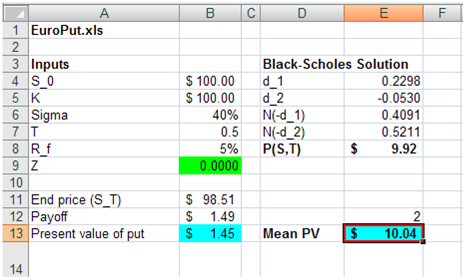
Figure 2: Black Sholes model using Crystal Ball
When we run this model for 10,000 trials, we obtain 2 forecasts: One for the present value of the option(see Figure 3) and the other is the Mean Present Value (Figure 4).
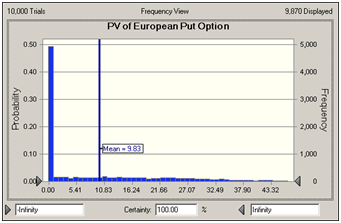

Figure 3: Present value of the option
The above forecast chart and statistics was generated using the first forecast cell in Figure 1. The chart below presents the distribution of the potential means associated with this simulation. It is worth noting that the mean shifted as the trials increased. Nevertheless, the usefulness of the knowing that the mean could also follow a distribution is very powerful but should be used with caution - generally because it will change each time a trial is added.
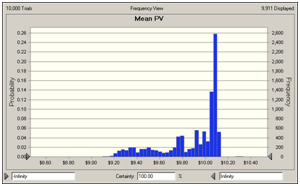
Figure 4: Distribution of the option's mean using the CB.GetForeStat function
HOW TO USE THE CB.GetForeStatFN
In Excel, you would use the following formula:
=CB.GetForeStatFN(ForecastCellLocation, Index)
=CB.GetForeStatFN(B13, 2) generates 9.83, the forecast's mean using the below forecast.
In order to extract the other parameters available in each forecast, use the following index parameters.
|
CB.GetForeStat (CellRef, Parameter)
|
|
1
|
Returns the number of trials
|
|
2
|
Returns the mean
|
|
3
|
Returns the median
|
|
4
|
Returns the mode
|
|
5
|
Returns the standard deviation
|
|
6
|
Returns the variance
|
|
7
|
Returns the skewness
|
|
8
|
Returns the kurtosis
|
|
9
|
Returns the coefficient of variation
|
|
10
|
Returns the range minimum
|
|
11
|
Returns the range maximum
|
|
12
|
Returns the range width
|
|
13
|
Returns the standard error
|
|
14
|
Returns the base case (initial value) of the forecast cell
|
|
50
|
Returns the Cp for short-term data (or Pp for long-term data)
|
|
51
|
Returns the Cpk-lower for short-term data (or Ppk-lower for long-term data)
|
|
52
|
Returns the Cpk-upper for short-term data (or Ppk-upper for long-term data)
|
|
53
|
Returns the Cpk for short-term data (or Ppk for long-term data)
|
|
54
|
Returns the Cpm for short-term data (or Ppm for long-term data)
|
|
55
|
Returns the Z-LSL
|
|
56
|
Returns the Z-USL
|
|
57
|
Returns the Z-st
|
|
58
|
Returns the Z-lt
|
|
59
|
Returns the p(N/C)-below LSL
|
|
60
|
Returns the p(N/C)-above USL
|
|
61
|
Returns the p(N/C)-total
|
|
62
|
Returns the PPM-below LSL
|
|
63
|
Returns the PPM-above USL
|
|
64
|
Returns the PPM-total
|
There are many other functions that use these indecies in Crystal Ball... to get a full list, please see the complete list here
If you have any questions on how to incorporate this function in your models and VBA macro's, please don't hesitate to drop me a line at [email protected]