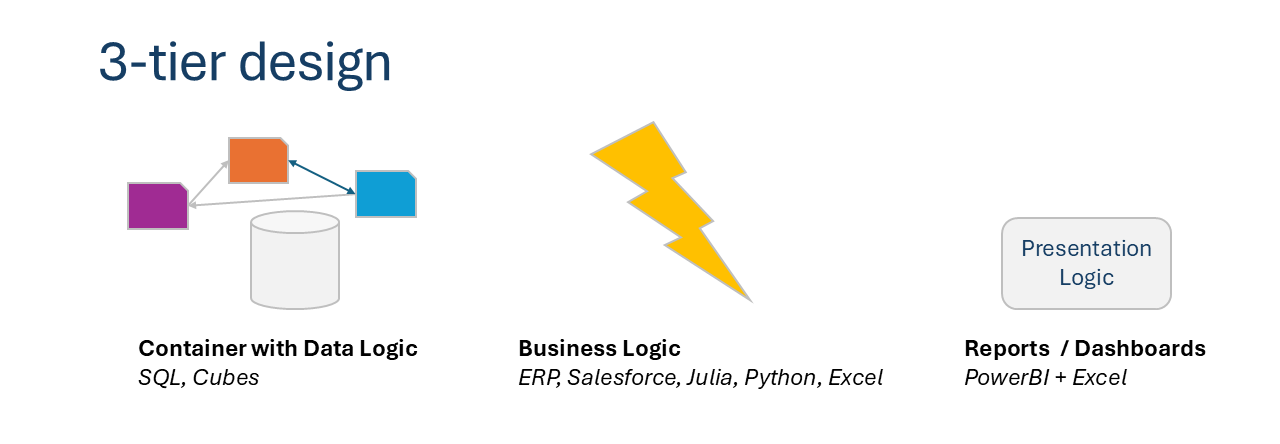
Are you an analyst wondering what comes next? Trying to avoid being put to the curb because of AI? Well, there are a few things that you need in your bag to remain relevant and have the first principles knowledge to avoid being automated out of existence. As an advanced Excel analyst, you might find your workbooks becoming increasingly complex, slow, and challenging to manage as they grow in size and complexity. By adopting a three-tier design approach—separating data management, business logic, and presentation layers—you can significantly improve the efficiency, scalability, and maintainability of your models.
Data Tier: Offload Data to SQL Databases and OLAP Cubes
As an advanced Excel analyst, you’ve likely encountered situations where the sheer volume of data starts to overwhelm Excel’s capabilities. Whether it’s handling large datasets, performing complex queries, or integrating data from multiple sources, you may have found Excel straining under the weight of these tasks. This is where SQL (Structured Query Language) comes in, offering a robust solution for data management and integration that can serve as the backbone of your analytical work.
SQL is the industry-standard language for interacting with relational databases, and learning it can significantly enhance your ability to manage and query data efficiently. By starting with SQL, you’ll lay a strong foundation that not only supports your current Excel-based models but also prepares you for the more advanced simulation work that lies ahead.
Why Start with SQL?
SQL is designed for the express purpose of querying and managing large datasets, which often reside in relational databases. Unlike Excel, which is best suited for smaller, static datasets, SQL excels at handling dynamic, relational data spread across multiple tables. Learning SQL will enable you to extract, filter, and manipulate data more efficiently, making it the perfect starting point for any advanced data analysis workflow.
With SQL, you can seamlessly pull data into your existing models, prepare it for analysis, and ensure that your simulations are based on accurate, up-to-date information. As you move towards more complex simulations and modeling tasks, SQL’s ability to handle large-scale data management becomes invaluable.
-
Learn SQL Basics: Begin by mastering the fundamentals of SQL, including SELECT statements, WHERE clauses, and JOIN operations. These core concepts will allow you to retrieve and manipulate data from multiple tables, ensuring that your models are built on a solid data foundation.
-
Integrate SQL with Excel: While learning SQL, practice integrating SQL queries with your existing Excel models. Excel’s ability to connect to external databases via ODBC or other methods allows you to pull in large datasets, run SQL queries, and update your data without leaving the familiar environment of Excel.
-
Prepare for Advanced Analytics: As you become more proficient in SQL, start exploring how it integrates with other programming languages like Julia and Python. This integration will enable you to streamline your workflow, moving data seamlessly from your databases into your simulation models.
Starting with SQL equips you with the tools to manage data at scale, setting the stage for more sophisticated modeling and simulation work.
Business Logic Tier: Automate with Julia and Other Tools
Once your data is managed externally, the next step is to automate the business logic that drives your models. This is where Julia and other programming tools come into play. By moving the complex calculations, simulations, and logic from Excel to a more powerful language like Julia, you can enhance the speed, reliability, and scalability of your models.
- Why Julia: Julia is designed for high-performance numerical computation, making it ideal for running simulations, optimizations, and complex calculations that would otherwise slow down Excel. It integrates well with databases, allowing you to pull data, process it, and feed the results back to Excel seamlessly.
- Automation Benefits: Automating your business logic reduces manual effort, minimizes the risk of human error, and ensures that your models can scale with your business needs. You can also use Python or other tools to further automate tasks, integrate with different systems, and enhance your workflow.
By handling the heavy computational tasks outside of Excel, you free up the spreadsheet to focus on what it does best: presenting data and insights.
Julia for High-Performance Simulations

Once you have a solid grasp of SQL and are comfortable managing and querying large datasets, the next step in your journey is to transition to Julia. Julia is a high-performance programming language designed for numerical computation, making it an ideal choice for porting and enhancing your Excel-based models.
While SQL lays the groundwork by managing your data, Julia takes things further by providing the computational power needed to run complex simulations, optimization models, and advanced mathematical analyses. Julia’s intuitive syntax and performance capabilities make it particularly appealing for analysts who need to scale up their models beyond what Excel can handle.
Why Transition to Julia?
Julia was designed with simplicity and performance in mind, making it an excellent choice for analysts looking to build more complex, computationally intensive models. Unlike other programming languages that can be cumbersome for numerical tasks, Julia allows you to write code that is both easy to read and incredibly fast to execute.
With Julia, you can replicate the functionality of your Excel models, but with the added benefits of scalability and speed. Whether you’re working on optimization problems, financial simulations, or statistical analyses, Julia provides the tools you need to elevate your work to a new level.
-
Learn Julia Basics: Start by familiarizing yourself with Julia’s syntax and core concepts. Julia’s design makes it easy for newcomers to pick up, especially if you have experience with other data-centric tools like Excel and SQL.
-
Explore DataFrames.jl: DataFrames.jl is Julia’s equivalent to Excel’s data tables, allowing you to manipulate and analyze datasets with greater efficiency. Begin by learning how to import, clean, and transform data using DataFrames.jl, much like you would in Excel, but with far greater speed.
-
Dive into JuMP.jl for Optimization: If your Excel models involve optimization, Julia’s JuMP.jl package will be a game-changer. JuMP.jl allows you to model and solve complex optimization problems with ease, providing a powerful alternative to Excel’s Solver.
By transitioning to Julia, you gain access to a language that can handle the computational demands of large-scale simulations and complex models, all while maintaining an intuitive and accessible syntax.
When you need to deploy in the cloud easily: Python

After mastering SQL for data management and Julia for high-performance simulations, Python is the final piece of the puzzle. Python’s versatility and extensive library ecosystem make it a valuable complement to the work you’ve already done in SQL and Julia. While Julia provides the computational power for simulations, Python offers unmatched flexibility for data manipulation, workflow automation, and integration with other tools.
Python is widely used in the data science community, and its extensive range of libraries can help you extend the capabilities of your models even further. Whether you’re looking to perform advanced data wrangling, develop machine learning models, or automate repetitive tasks, Python has the tools you need.
Why Add Python to Your Toolkit?
Python’s strength lies in its versatility and the breadth of its applications. It’s particularly useful for tasks that involve extensive data manipulation, integration with various systems, or the need for rapid prototyping. While Julia excels in speed and performance for numerical tasks, Python provides the flexibility to handle a wide range of other tasks that you might encounter in your analytical work.
Python’s libraries, such as Pandas for data manipulation and NumPy for numerical operations, are essential tools for any analyst. Additionally, Python’s interactive environment, Jupyter Notebooks, allows you to document your work, combine code with narrative text, and share your findings with others in a seamless, interactive format.
-
Learn Python Basics: Begin with the basics of Python, focusing on understanding its syntax and core programming concepts. Python’s straightforward design makes it accessible even for those new to programming.
-
Master Pandas for Data Wrangling: Pandas is Python’s go-to library for data manipulation, and it’s a natural extension of the work you’ve done with DataFrames in Julia. Learn how to clean, filter, and transform data efficiently using Pandas.
-
Explore NumPy and SciPy for Advanced Computation: For tasks that require advanced mathematical computations, NumPy and SciPy provide powerful tools that complement Julia’s capabilities. These libraries are essential for extending your simulation models and performing complex analyses.
-
Utilize Jupyter Notebooks for Documentation: Jupyter Notebooks offer an interactive environment where you can combine code, text, and visualizations in a single document. This makes it easy to document your models, share your work, and collaborate with others.
By incorporating Python into your workflow, you gain a versatile tool that complements the strengths of SQL and Julia, enabling you to tackle a broader range of analytical challenges with confidence.
Presentation Tier: Use Excel and PowerBI as the User Interface
 +
+
Finally, Excel remains an excellent tool for the presentation tier, where you interact with the data and results. Excel’s intuitive interface, powerful charting capabilities, and familiarity make it the ideal platform for presenting and interpreting the outputs of your automated models.
- Why Excel: Excel’s flexibility and ease of use make it perfect for creating dashboards, reports, and visualizations. By linking Excel to your SQL databases and Julia-automated models, you can pull in the latest data, run analyses, and present results all within a familiar environment.
- Interactive Dashboards: Excel’s capabilities can be leveraged to build interactive dashboards that update automatically based on data pulled from your external sources, making it easier for stakeholders to explore insights without compromising on performance.
Conclusion
Starting with SQL gives you a strong foundation for managing and integrating data, ensuring that your models are built on a solid base of accurate, well-organized information. From there, transitioning to Julia allows you to scale up your models, harnessing the computational power needed for complex simulations and analyses. Finally, adding Python to your toolkit provides the flexibility to handle a wide variety of tasks, from data wrangling to automation, rounding out your ability to build and deploy sophisticated models.
By adopting this three-tier design—offloading data management to SQL and OLAP cubes, automating business logic with Julia, and using Excel or PowerBI for presentation—you optimize your Excel models for better performance, scalability, and usability. This approach allows you to maintain the user-friendly interface of Excel while significantly enhancing the power and reliability of your underlying models.