The Need for Speed: A performance comparison of Crystal Ball, ModelRisk, @RISK and Risk Solver
Analytics Articles

The Need for Speed: A performance comparison of Crystal Ball, ModelRisk, @RISK and Risk Solver

Eric Torkia

Share:

Print

Rate article:

No rating
Rate this article:
No rating

Need for SpeedA detailed comparison of the top Monte-Carlo Simulation Tools for Microsoft Excel

There are very few performance comparisons available when considering the acquisition of an Excel-based Monte Carlo solution. It is with this in mind and a bit of intellectual curiosity that we decided to evaluate Oracle Crystal Ball, Palisade @Risk, Vose ModelRisk and Frontline Risk Solver in terms of speed, accuracy and precision. We ran over 20 individual tests and 64 million trials to prepare comprehensive comparison of the top Monte-Carlo Tools.


Introduction


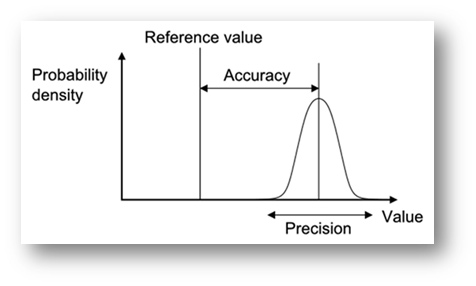
Figure 1: Precision Vs. Accuracy (source: http://en.wikipedia.org/wiki/Accuracy_and_precision)

In this article, we are going to cover an aspect of Monte Carlo tools which we are sure will be of interest to many – speed, accuracy and precision. Purely by accident, our curiosity was piqued when we ran several simulations and noticed that the standard deviation was moving around at certain percentiles at different rates than others. Therefore, we started wondering how much volatility would naturally occur at various percentiles across different packages.Our testing focused on two different aspects: accuracy and precision. We used the correlated returns model from our previous article as our test model. We ran the model 20 times at 10 000, 50 000 and 100 000 trials, resulting in 60 simulations per package. Furthermore, we ran three sets of tests, each of which removed an element that could throw the results off. The first test consisted of fitting data that had been generated using a Monte Carlo tool. The second test consisted of fitting data from actual data to eliminate fitting error that could potentially arise from using simulated data. The third test used normal distributions for all the assets in order to completely eliminate potential fitting error and put all the applications on the same footing.

In order to test for accuracy we averaged out the values of all 20 simulations for each percentile/package and compared the results against the calculated form using the Markowitz mean variance approach. As for precision, we looked at the standard deviation of each percentile/package at a given number of trials for all 20 simulations. For example, we would look at the standard deviation at the 99th percentile using a sample of 20 simulations at 10,000 trials each (200,000 trials total).

Our basic objective when analyzing a package for precision is whether it follows a certain set of statistical rules. A good example would be the expectation for a reduction of standard deviation as we increase the number of trials at a given percentile. When we set up the script to test the accuracy of each tool we realized that it would be easy to do a performance comparison as well. This turned out to be an added bonus! During the scripted tests, we also took into account the execution time of the whole script and that of each simulation. We also evaluated the average trials/sec for both the test and the individual simulations.


Tests and Analysis

Test Environment

Our test machine consisted of a Dell Dimensions XPS system with a 3.2 GHz dual core Pentium D, 4 GB of RAM, Windows XP and Microsoft Office 2010

Our Test Model

We are an investor that seeks to evaluate the risk in his portfolio. We have $250,000 to invest and we would like to make sure we have a better chance at making money than losing it. For purposes of the exercise, we have allocated our investment equally among each asset class at 25% a piece.  We analyzed the rank correlation (using the Excel based method presented Copulas vs. Correlation) and prepared a correlation matrix that was used to correlate the returns distributions for each class. Please refer to our previous article on correlating distributions where we have prepared a video on how to do this with each package.

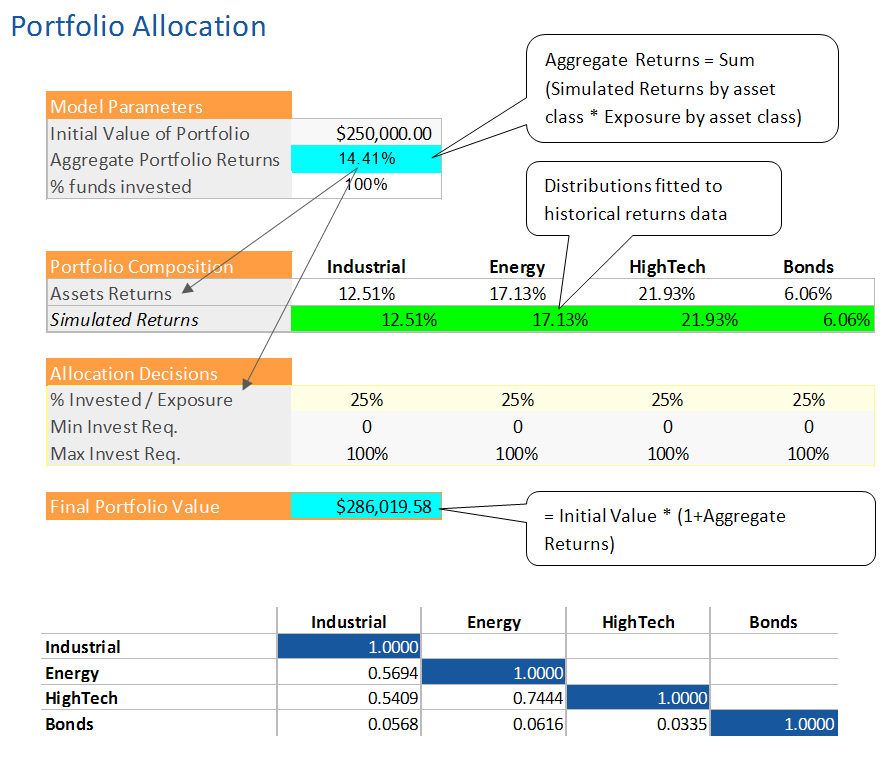
Since the applications fit the data using mostly normal distributions, we chose to use the Markowitz mean variance optimization method as a benchmark for the results at various numbers of trials (10k, 50k, and 100k).

With the Markowitz benchmarking data in hand, the first thing to do is contrast correlated versus uncorrelated results.


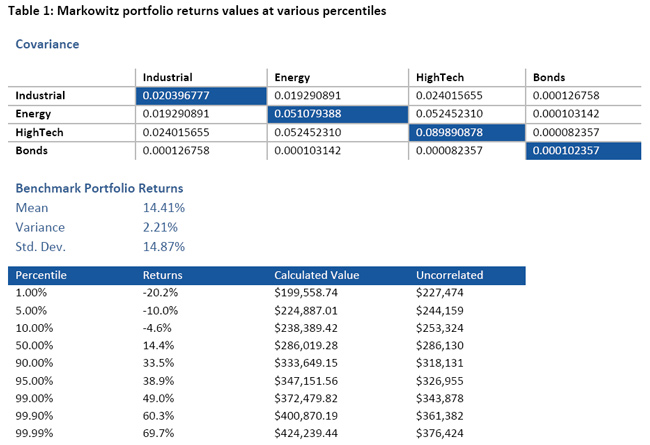
Clearly, the difference between the correlated and uncorrelated percentile values increases as we move away from the 50th percentile or Median. If we run this model without taking into account the correlation, we would be underestimating both the lower bound (loss) by almost 30 000$ and the upper bound by almost 50 000$. The consequence is that we are making decisions on the wrong range and risk profile – which could potentially be very good but mostly very bad because we are underestimating the downside risk.

The impact of correlation on the results

We ran each test with correlation turned on and off on all packages and tracked the results. This enabled us to both look at the results and the performance differences when handling correlation. The initial test was run only once with the correlation turned on while the two tests were run with it both on and off.


Curious about the results? Download Full Article and Test Results

Download the complete ZIP File. Read our comprehensive white paper analyzing the test results as well as the complete set of test results in Excel for slicing and dicing.

Comments

Collapse Expand Comments (0)
You don't have permission to post comments.

Oracle Crystal Ball Spreadsheet Functions For Use in Microsoft Excel Models

Oracle Crystal Ball has a complete set of functions that allows a modeler to extract information from both inputs (assumptions) and outputs (forecast). Used the right way, these special Crystal Ball functions can enable a whole new level of analytics that can feed other models (or subcomponents of the major model).

Understanding these is a must for anybody who is looking to use the developer kit.

Why are analytics so important for the virtual organization? Read these quotes.

Jun 26 2013
6
0

Since the mid-1990s academics and business leaders have been striving to focus their businesses on what is profitable and either partnering or outsourcing the rest. I have assembled a long list of quotes that define what a virtual organization is and why it's different than conventional organizations. The point of looking at these quotes is to demonstrate that none of these models or definitions can adequately be achieved without some heavy analytics and integration of both IT (the wire, the boxes and now the cloud's virtual machines) and IS - Information Systems (Applications) with other stakeholder systems and processes. Up till recently it could be argued that these things can and could be done because we had the technology. But the reality is, unless you were an Amazon, e-Bay or Dell, most firms did not necessarily have the money or the know-how to invest in these types of inovations.

With the proliferation of cloud services, we are finding new and cheaper ways to do things that put these strategies in the reach of more managers and smaller organizations. Everything is game... even the phone system can be handled by the cloud. Ok, I digress, Check out the following quotes and imagine being able to pull these off without analytics.

The next posts will treat some of the tools and technologies that are available to make these business strategies viable.

Multi-Dimensional Portfolio Optimization with @RISK

Jun 28 2012
16
0

Many speak of organizational alignment, but how many tell you how to do it? Others present only the financial aspects of portfolio optimization but abstract from how this enables the organization to meets its business objectives.  We are going to present a practical method that enables organizations to quickly build and optimize a portfolio of initiatives based on multiple quantitative and qualitative dimensions: Revenue Potential, Value of Information, Financial & Operational Viability and Strategic Fit. 
                  
This webinar is going to present these approaches and how they can be combined to improve both tactical and strategic decision making. We will also cover how this approach can dramatically improve organizational focus and overall business performance.

We will discuss these topics as well as present practical models and applications using @RISK.

Reducing Project Costs and Risks with Oracle Primavera Risk Analysis

.It is a well-known fact that many projects fail to meet some or all of their objectives because some risks were either: underestimated, not quantified or unaccounted for. It is the objective of every project manager and risk analysis to ensure that the project that is delivered is the one that was expected. With the right know-how and the right tools, this can easily be achieved on projects of almost any size. We are going to present a quick primer on project risk analysis and how it can positively impact the bottom line. We are also going to show you how Primavera Risk Analysis can quickly identify risks and performance drivers that if managed correctly will enable organizations to meet or exceed project delivery expectations.

.


Modeling Time-Series Forecasts with @RISK


Making decisions for the future is becoming harder and harder because of the ever increasing sources and rate of uncertainty that can impact the final outcome of a project or investment. Several tools have proven instrumental in assisting managers and decision makers tackle this: Time Series Forecasting, Judgmental Forecasting and Simulation.  

This webinar is going to present these approaches and how they can be combined to improve both tactical and strategic decision making. We will also cover the role of analytics in the organization and how it has evolved over time to give participants strategies to mobilize analytics talent within the firm.  

We will discuss these topics as well as present practical models and applications using @RISK.

The Need for Speed: A performance comparison of Crystal Ball, ModelRisk, @RISK and Risk Solver


Need for SpeedA detailed comparison of the top Monte-Carlo Simulation Tools for Microsoft Excel

There are very few performance comparisons available when considering the acquisition of an Excel-based Monte Carlo solution. It is with this in mind and a bit of intellectual curiosity that we decided to evaluate Oracle Crystal Ball, Palisade @Risk, Vose ModelRisk and Frontline Risk Solver in terms of speed, accuracy and precision. We ran over 20 individual tests and 64 million trials to prepare comprehensive comparison of the top Monte-Carlo Tools.


Excel Simulation Show-Down Part 3: Correlating Distributions

Escel Simulation Showdown Part 3: Correlating DistributionsModeling in Excel or with any other tool for that matter is defined as the visual and/or mathematical representation of a set of relationships. Correlation is about defining the strength of a relationship. Between a model and correlation analysis, we are able to come much closer in replicating the true behavior and potential outcomes of the problem / question we are analyzing. Correlation is the bread and butter of any serious analyst seeking to analyze risk or gain insight into the future.

Given that correlation has such a big impact on the answers and analysis we are conducting, it therefore makes a lot of sense to cover how to apply correlation in the various simulation tools. Correlation is also a key tenement of time series forecasting…but that is another story.

In this article, we are going to build a simple correlated returns model using our usual suspects (Oracle Crystal Ball, Palisade @RISK , Vose ModelRisk and RiskSolver). The objective of the correlated returns model is to take into account the relationship (correlation) of how the selected asset classes move together. Does asset B go up or down when asset A goes up – and by how much? At the end of the day, correlating variables ensures your model will behave correctly and within the realm of the possible.

Copulas Vs. Correlation

Copulas and Rank Order Correlation are two ways to model and/or explain the dependence between 2 or more variables. Historically used in biology and epidemiology, copulas have gained acceptance and prominence in the financial services sector.

In this article we are going to untangle what correlation and copulas are and how they relate to each other. In order to prepare a summary overview, I had to read painfully dry material… but the results is a practical guide to understanding copulas and when you should consider them. I lay no claim to being a stats expert or mathematician… just a risk analysis professional. So my approach to this will be pragmatic. Tools used for the article and demo models are Oracle Crystal Ball 11.1.2.1. and ModelRisk Industrial 4.0

Excel Simulation Show-Down Part 2: Distribution Fitting


One of the cool things about professional Monte-Carlo Simulation tools is that they offer the ability to fit data. Fitting enables a modeler to condensate large data sets into representative distributions by estimating the parameters and shape of the data as well as suggest which distributions (using these estimated parameters) replicates the data set best.

Fitting data is a delicate and very math intensive process, especially when you get into larger data sets. As usual, the presence of automation has made us drop our guard on the seriousness of the process and the implications of a poorly executed fitting process/decision. The other consequence of automating distribution fitting is that the importance of sound judgment when validating and selecting fit recommendations (using the Goodness-of-fit statistics) is forsaken for blind trust in the results of a fitting tool.

Now that I have given you the caveat emptor regarding fitting, we are going to see how each tools offers the support for modelers to make the right decisions. For this reason, we have created a series of videos showing comparing how each tool is used to fit historical data to a model / spreadsheet. Our focus will be on :

The goal of this comparison is to see how each tool handles this critical modeling feature.  We have not concerned ourselves with the relative precision of fitting engines because that would lead us down a rabbit hole very quickly – particularly when you want to be empirically fair.

RESEARCH ARTICLES | RISK + CRYSTAL BALL + ANALYTICS