 Modeling in Excel or with any other tool for that matter is defined as the visual and/or mathematical representation of a set of relationships. Correlation is about defining the strength of a relationship. Between a model and correlation analysis, we are able to come much closer in replicating the true behavior and potential outcomes of the problem / question we are analyzing. Correlation is the bread and butter of any serious analyst seeking to analyze risk or gain insight into the future.
Given that correlation has such a big impact on the answers and analysis we are conducting, it therefore makes a lot of sense to cover how to apply correlation in the various simulation tools. Correlation is also a key tenement of time series forecasting…but that is another story.
In this article, we are going to build a simple correlated returns model using our usual suspects (Oracle Crystal Ball, Palisade @RISK , Vose ModelRisk and RiskSolver). The objective of the correlated returns model is to take into account the relationship (correlation) of how the selected asset classes move together. Does asset B go up or down when asset A goes up – and by how much? At the end of the day, correlating variables ensures your model will behave correctly and within the realm of the possible.
How we setup the model
Loading the player ...

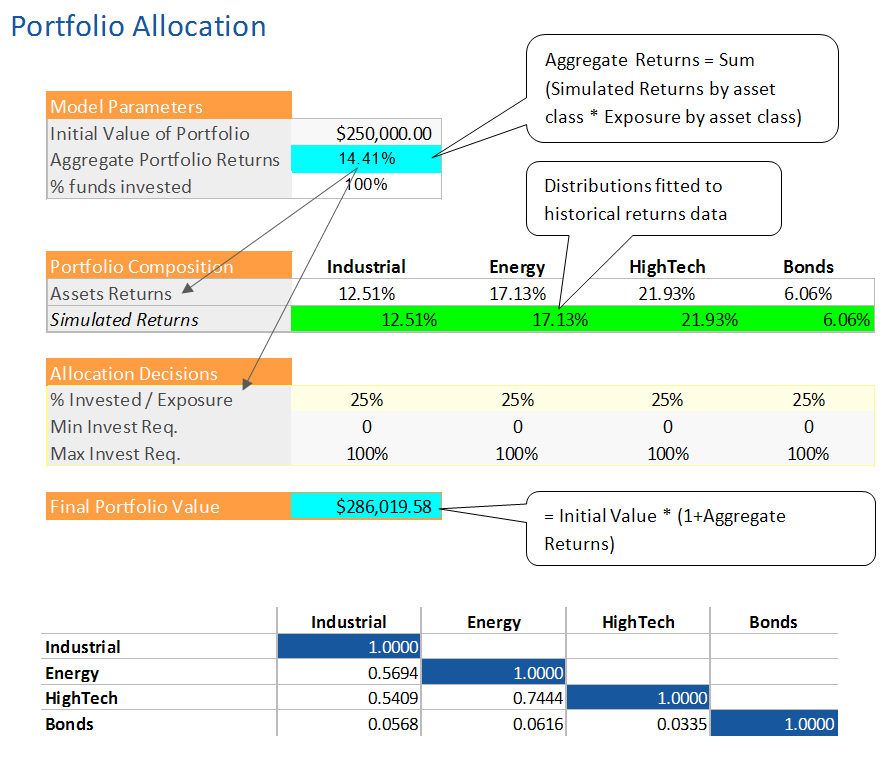
We are an investor that seeks to evaluate the risk in his portfolio. We have $250,000 to invest and we would like to make sure we have a better chance at making money than losing it. The distributions were fitted using historical returns which are included in the test sheet (For more information on how to fit distributions please refer to Excel Simulation Show-Down Part 2: Distribution Fitting).
For purposes of the exercise, we have allocated our investment equally among each asset class at 25% a piece. We analyzed the rank correlation (using the Excel based method presented in Copulas Vs. Correlation) and prepared a correlation matrix that was used to correlate the returns distributions for each class. We have prepared a video on how to do this with each package.
Many will recognize that the natural next step for this model is to optimize allocation, but again you will have to stay tuned as this is planned for a future post.
Clearly, the difference between the correlated and uncorrelated percentile values increases as we move away from the 50th percentile or Median. If we run this model without taking into account the correlation, we would be underestimating both the lower bound (loss) by almost 30 000$ and the upper bound by almost 50 000$. The consequence is that we are making decisions on the wrong range and risk profile – which could potentially be very good but mostly very bad because we are underestimating the downside risk.
Oracle Crystal Ball and Correlation
Loading the player ...

Correlation in Crystal Ball is done using a modified Iman-Connover Method translating into a Normal Copula. Correlation is expressed and calculated using Spearman’s Rank Order methodology. Oracle Crystal Ball is a little different that the other players in that it has made correlation a point and click affaire. Nevertheless if you want to correlate manually, you will need to calculate the rank correlation as I have outlined previously or use the automated tools in Crystal Ball.
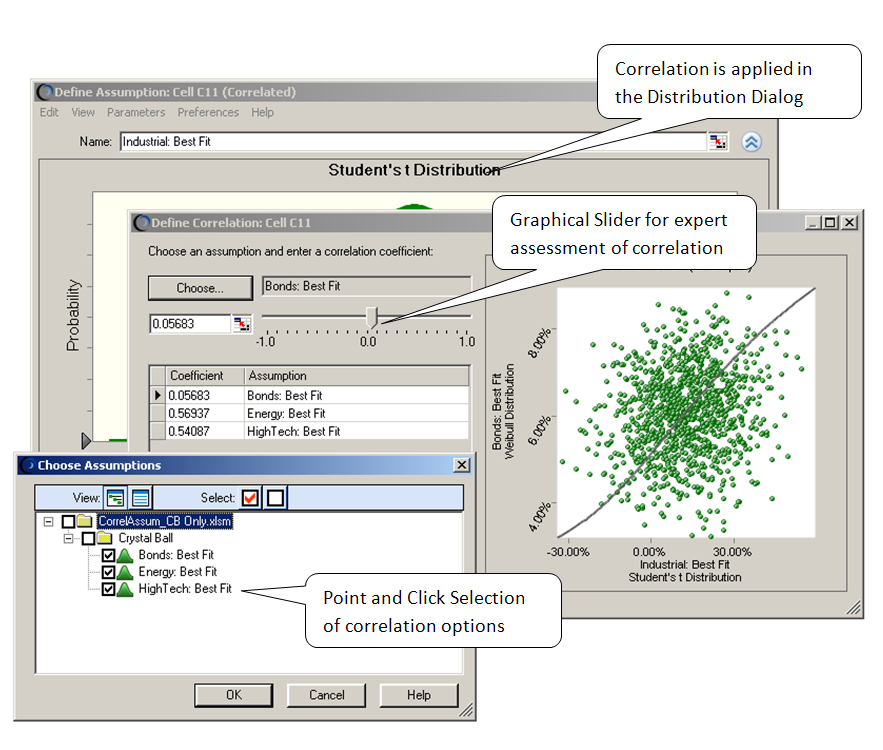
For example, you can, like in @RISK and Solver, generate a linked correlation matrix or use the Batch Fit Tool (in the Crystal Ball Tools menu). The BatchFit tool is cool because it will fit a distribution to each row or column of data… so it can loop through a whole data set. The Batch Fit tool then proceeds to calculate a positive definite correlation matrix, correlates the distributions together and embeds it in the model for user modification. This is a real time saver… sometimes saving upwards of 30 to 60 minutes of low value work. My only concern, as is the case with most fitting tools, is that it will always pick the best empirical fit and not always the most logical. As a consequence, you may have to edit the parameters of the distribution(s) to reflect another fit. Fortunately you get a fit report with all the ranking data for further analysis, including the parameters. Re-configuring distributions manually is not great but it’s better than nothing at all.
From a graphing point of view Crystal Ball offers scatter plots and 2 kinds of sensitivity analysis – Rank Order and Contribution to Variance. All in all, Crystal Ball is one of the most flexible and easy to use correlating tools for Spearman’s Rank Order Approach. People just getting into simulation and analysis should seriously consider Crystal Ball as their starting point.
Palisade @RISK
Loading the player ...

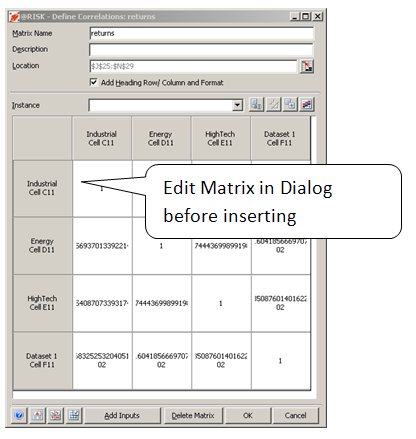 Palisade @RISK also uses Iman-Connover and its derivative Normal Copula to correlate assumptions together. @RISK relies on Spearman’s Rank Order method to assess the dispersion or rather the strength between variables. @RISK has added some point and click features for selecting the input assumptions directly from the worksheet and embedding correlation into the worksheet in the form of a matrix. You can edit the correlation matrix either through the dialog box or directly in the excel worksheet. If you have already calculated the Rank Correlation Matrix as we have done, you can just paste the values in the table. @RISK does not offer the ability to fit Spearman Rank Order correlation like you can with Crystal Ball or ModelRisk, so you will have to build out your own Correlation Matrix.
I advise anybody who wants to use the correlation matrix tool from the Analysis Toolpack as a substitute to doing the rank correlation work – Don’t. The correlation tool does Pearson’s correlation coefficient… so using the numbers generated in this table will cause errors in the correlation because of double conversion (Pearson --> Pearson vs. Spearman --> Pearson). It is worth mention that you have a feature to ensure that the matrix is Positive Definite (or that it makes sense mathematically.).

@RISK offers 3 types of correlation charts, including Regression Coefficients, Rank Correlation, Mapped Values. As with all the other tools you can build scatter plots against several distributions. At first the point and click approach used by @RISK is a little confusing, but you will get used to it.
All in all, @RISK offers a solid, straightforward, no-frills approach to correlation. I would definitely value some automation around fitting / calculating Rank Order Correlation in a data set. Either a formula or a simple wizard would get the job done and save users lots of time.
Vose ModelRisk
Loading the player ...

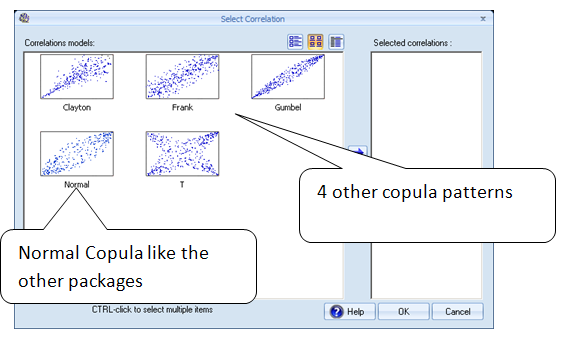
One of the areas where Vose Software has differentiated itself from the pack is correlation. ModelRisk employs an approach to correlation known as Copulas (We cover this in greater detail in Copulas Vs. Correlation). In essence Copulas, like distributions, are intended to model certain behaviors in a model. In the case of Copulas, the behavior modeled is the relationship between variables versus the variability or uncertainty in an array of numbers – as is the case with distributions.
ModelRisk, like the other packages, offers a normal Copula to link 2 or more distributions together. But wait, you have access to 4 other correlation patterns to work with. Given you are faced with a new set of options to build correlation into your model, Vose has extended its application of Information Criteria (Covered in Excel Simulation Show-Down Part 2: Distribution Fitting) fitting to correlation. It will fit and rank the appropriate correlation to help you select the best fit. This option is only available in the professional and industrial versions. In addition, you can add uncertainty to your Copula, dynamically integrating second order risk into your model.
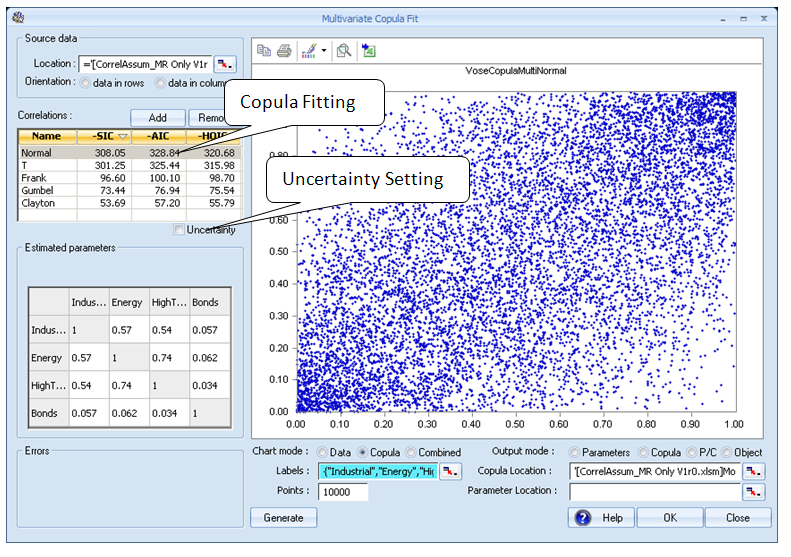
ModelRisk offers 7 different correlation charts and the ability to visualize correlation in a data set using its Ad Hoc Data Viewer. Visualization is a big thing with Vose Software so they have improved the usability and the customization of its charts. We explore this in the video.
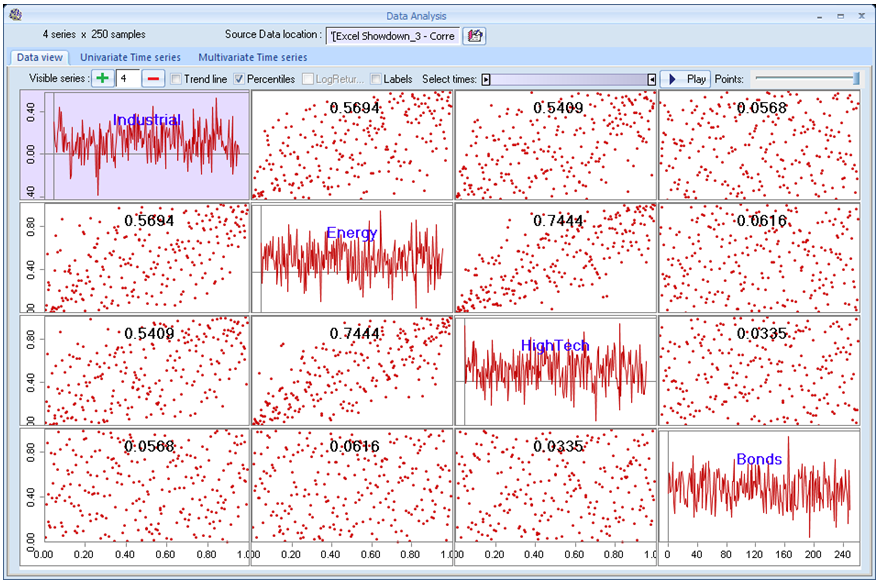
ModelRisk offers a bunch of useful functions that will streamline the calculation of correlation in datasets. To this affect, they offer both Kendall’s Tau and Spearman’s Rho as simple functions, thus eliminating the need to build complex worksheets. But given the way Copulas are used, these are more for analysis and formula building rather than correlating. In fact, there is no way to use Spearman’s correlation coefficient to correlate in ModelRisk.
But let consider that Vose Software is like a Genie in a bottle granting wishes for more powerful software to risk analysts. As always, a genie will exact a price for its benevolence. It is a long established fact that more power, at least in the field of risk analysis, requires more sophistication. So you will need to bone up on your understanding of the fundamentals of correlation. The help file is very complete in this regard. My long experience with Vose Software is they are quite serious and rigorous around the math and the algorithms. However, some of the math used to fit and generate the Copulas are trade secrets and require the analyst to have faith in the methods employed.
For a more detailed treatise on Copulas and their benefits, check out our previous article Copulas Vs. Correlation.
Frontline Risk Solver
Loading the player ...

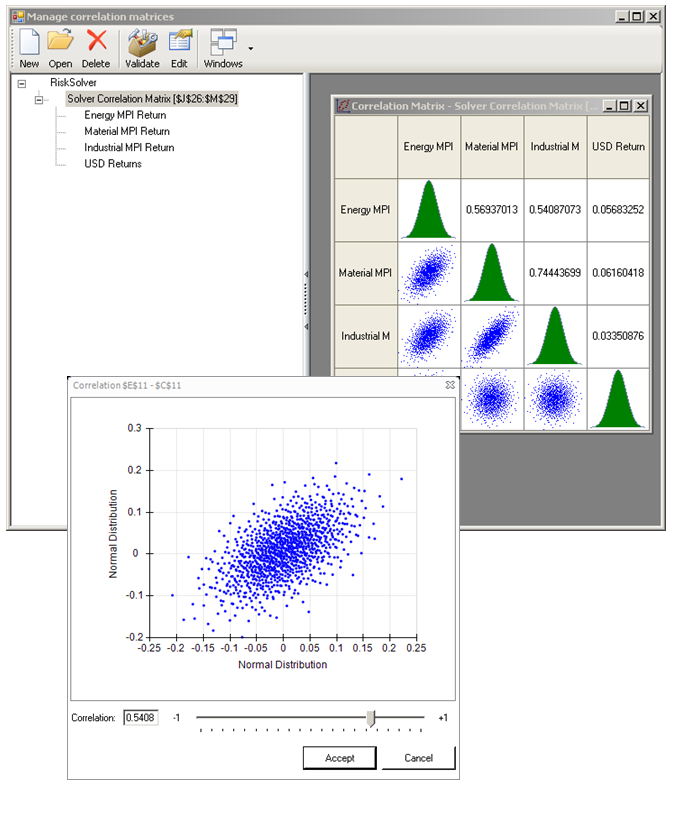 Frontline Risk Solver has been working on improving the usability and ergonomic set up of its correlation tool. Risk Solver is very much like at @RISKin its implementation of Correlation with one notable exception, how to make a matrix positive definite. If for some reason, your correlation matrix is not Positive Definite, then you can prioritize how the tool will balance out the matrix to make it so.
Another interesting feature is if you already have a matrix calculated, it will import the values on Save and then generate a mixed Graphical / Correlation Matrix. If you double click on the matrix, like Crystal Ball, you will be able to change the correlation with a slider. The only inconvenience is that the names of the distributions are not listed in the slider box thus leading to some confusion. A small charting fix to be sure.
From a charting perspective, they offer both sensitivity and scatter plots. Sensitivity data is presented both in Pearson’s and Spearman Correlation Coefficients. Very straightforward stuff.
Frontline has clearly overhauled their correlation tool into something that is much improved. As with @RISK , a correlation fitting tool or functions would be very welcome addition and would save the risk analyst a bunch of time. On a personal level, I wish you could set the way the correlation matrix triangle is set up… currently you can only get the upper triangle… This is a user preference issue, but one that would make my life easier.
In the end, Frontline has done a good job making their tool better and quite usable.
Conclusion
Can a father really have a favorite child? The cynics will say yes whereas I am more of an old-school romantic with no kids – so I say no, they are all special but not the same. I tend to feel this way about all four of the tools we looked at, however it is also true they are different and those differences may be important to you.
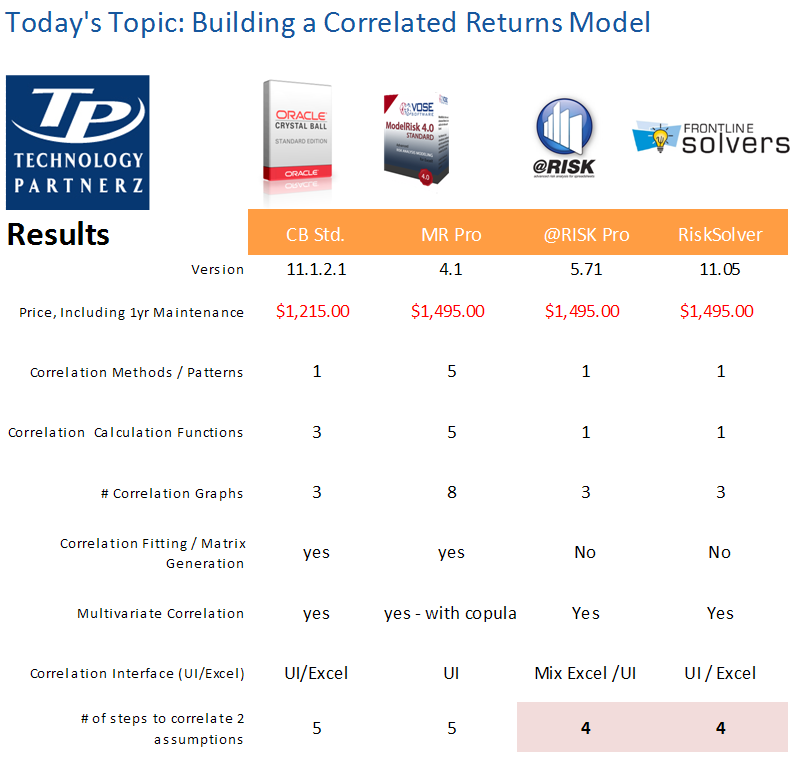
You may notice the number are a little different in our recap than in the movies… we double checked some facts and made some updates.
Price
In order to build the correlated returns model presented above, you will spend between 1200-1500$ - Period. You can spend more to get the big brother editions (which I personally prefer and often recommend) to benefit from the other complimentary features that make simulation an even more compelling analysis tool.
Correlation Patterns
All 4 packages include some version of a “Normal” Copula to join 2 distributions together. Often based on the seminal work of Iman-Connover (1982), these packages share a certain amount of history and philosophy around correlation. That is not to say they have implemented the math the same way, just that they are working from the same set of rules.
Vose Software has an edge here as it is the only package that enables you to select or fit other correlation patterns than a Normal Copula. This is both a powerful and esoteric feature, especially for the uninitiated. In any case, building these things are absolute hell in excel and to have this kind of functionality in a wizard driven interface is wonderful for those who need it. My only annoyance is that I can’t correlate the old way using Spearman’s Rho and a Normal (like) Copula as I can in the other packages. This unfortunately increases the learning curve and the need to hit the books because what Vose Software is doing is so different.
To quote a friend, sometimes you don’t need a Mercedes; a Volkswagen will get you there just the same.
Correlation functions
Both ModelRisk and Crystal Ball offer multiple ways to apply correlation to a model. In the case of ModelRisk, you have correlation calculation functions, matrix tools and copula fitting. You even have the ability to calculate covariance, Spearman’s Rho and Kendall’s tau using cool functions, saving a user lots of tedious work for advanced risk models.
Crystal Ball offers the ability to both fit and correlate data in one fallow swoop using batch fit. You can also use embedded or temporary correlation matrices to correlate bigger sets of distributions. Unlike ModelRisk’s creative use of functions, Crystal Ball uses simple and effective wizards.
As for @RISK and RiskSolver, they both use embedded correlation matrices such as the ones proposed by Crystal Ball. When it comes to embedding correlation for a series of distributions, both these tools are very clean and efficient. Unfortunately, they do not offer any functions or support to calculate or fit correlation in a data set. This is still the purview of the analyst and his methods.
Correlation Graphs
All the tools offer essentially the same ways of analyzing correlation in a model – Sensitivity Analysis and Scatter Plots. Vose ModelRisk has the most ways of looking at sensitivity data with 7 chart types. Some of these are very scientific and specialized… but available.
All the other tools offer 2 or 3 ways to look at sensitivity as well as scatter plots. This is sufficient for most applications but may leave the power user/super geek wanting more or jimmy rigging more.
Correlation Fitting
Only ModelRisk and Crystal Ball allow for correlation fitting in a dataset. I hope this feature will be added soon to the other two because you can save a lot of time and anguish.
Usability
We have double checked the packages and they all require a similar amount of steps to correlate to items together. It is worth mentioning that ModelRisk forces you to fit, therefore resulting in a few additional steps. If you were to forego the fitting, it is only a question of adding the right parameter to the formula.
Crystal Ball has definitely the most graphical and intuitive interface to correlate assumptions across a workbook. This enables iterative modeling and the correlation of items across worksheets in an easy to follow process. The Batch Fitting tool is both cool, unique and a time saver… as long as you make sure it picked the right fits.
RiskSolver and @RISK take fewer steps to correlate items together but only offer one way to do it. Efficient usability is definite hallmarks of these packages but they could add more meat on the bone to cut modeling time for mundane tasks related to correlation.


I would like to thank the people at Vose Software, Palisade, Oracle and Frontline systems for their continued support and availability to answer our questions as well as provide insight.
If you have any questions or comments, please don't hesitate to drop me a line at 1-888-879-8440 or send me a note at [email protected].