Feb
03
2011
 In our quest to simulate future Duke Basketball scores, we have taken past historical data of individual games during the '09/'10 season and fitted probability distributions to that data. Two PDFs are generated; one for Duke's scores (offense) and one for their opponents' scores (defense). We have used both Crystal Ball and ModelRisk to perform this task. Is there something missing in our PDF formulations?
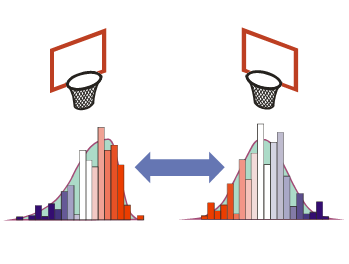
There is. Examine the data carefully. Does there appear to be a rough pattern or correlation between the offense scores and scores allowed by Duke's defense? For many of the games, even if the Duke score is lower than the average for all Duke offense scores, the opponent seems to score less as well compared to the average of all Duke's opponents. In other words, there is a positive correlation between the sets of paired data samples. Calculated values for Pearson's, Spearman's and Kendall's Tau coefficient appear to be in agreement. (These values are in Cells C42:E42.) If this behavior was not modeled properly, then any future simulation of Duke Basketball outcomes would predict more Duke losses than the data really indicates. Last year's Duke squad did a good job of defense when their offense was not chugging on all cylinders!
To implement correlation behavior in CB between two CB Assumptions, the user must define the Spearman's coefficient within a set of CB windows. We will do this between the first best-fitting PDF for Duke scores and the first best-fitting PDF for opponent scores. After opening the Duke 09_10 Scores spreadsheet with Crystal Ball loaded within MS Excel, perform the following steps:
- Click on Cell I5.
- Select "Define Assumption" in the CB ribbon bar. (This will open the CB Assumption in a separate window; this first best-fitting PDF was previously defined by fitting to the Duke offense score data in Column C.)
- Select "Correlate…" in the lower left-hand corner.
- Select "Choose..." in upper right-hand corner. (A list of CB Assumptions will come up with check boxes for all other CB Assumptions in your spreadsheet.)
- Check the box for first best-fitting CB Assumption associated with opponent score (a Negative Binomial).
The user has the option, at this time, to define a Spearman's coefficient by either
- typing values in manually (done just below "Choose…" button),
- cell-referencing to a cell which has a coefficient value pre-defined (perhaps via Excel formula), or
- having CB calculate a Spearman's coefficient directly from data in the worksheet.
We will use the third approach as follows:
- Select "Calc…" button.
- Using cell-reference-picker, identify first cell range as C4:C37 and second cell range as D4:D37.
- Select "OK."
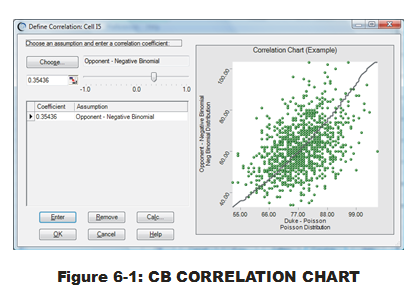
As visualized in the data scatter chart, there is a positive correlation between Duke's offensive outputs and that of their opponents (see Fig. 6-1). The Spearman's coefficient value is approximately 0.35. Most analysts would term this a weak-to-intermediate correlation at best. Perhaps it won't have as much impact on our simulation results? But it is strong enough for consideration. (Crystal Ball does have a functionality to turn off all defined correlations in the CB Assumptions. Using this CB feature allows comparative MCA runs (with and without correlations) to determine magnitude of variance impact, which I highly recommend for all MCA models, regardless of code.)
- Select "OK."
- Select "OK" once more to return to normal Excel mode.
During the above process, the user was required to enter the correlations by first selecting the cell with the CB Assumption and then accessing that CB entity by selecting "Define Assumption." Users may consider the CB entity accessed this way as the comparative equivalent of an MR object. From their perspective, this can type of "click-through" access can be a good or bad thing. Good in that it error-proofs (to a certain extent) casual users from accidentally modifying or destroying the CB entities. Bad in that it does not allow direct access to the advanced spreadsheet user, like MR Objects do. User preferences should be considered here before committing to particular software.
Another point: In the above process, the user is provided a list of CB Assumptions to choose from, as shown in Fig. 6-2. Beautiful organization abounds. The user can see all CB Assumptions in all worksheets with all open workbooks.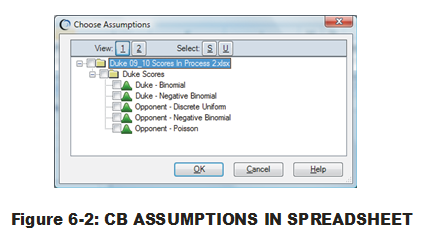 Worksheets and workbooks are represented by folders, much like folders represent directories in Windows Explorer. (If all are not visible, use the 'plus' and 'minus' signs preceding the folder symbols to open and close folders.) Naming conventions for your CB Assumptions become important here. Otherwise, the user is presented with a set of names based on cell reference locations only
Karl Luce is a Solutions Specialist who has a deep passion for using Monte Carlo analysis as a Six Sigma tool and quantifying uncertainty in the universe. His past roles included training Crystal Ball and quality concepts as a Design for Six Sigma (DFSS) Master Black Belt and a Six Sigma Transactional Black Belt. He received his BS in Aeronautical/Astronautical Engineering from M.I.T. in 1985. Prior to joining Oracle in 2005, Karl held analytical and managerial positions within Fortune 500 corporations in the defense aerospace and automotive industries.