Feb
14
2011
 Correlation behavior in ModelRisk is enforced with the use of copulas. Copulas offer more flexibility in accurately simulating real data scatter-plot patterns than do single-value correlation coefficients. While this advantage is clear for financial and insurance applications, its implementation in an MCA spreadsheet simulator can make the difference between universal adoption and rejection by a majority of the intended user group. Let us now use ModelRisk (MR) to enforce the correlation behavior between Duke Basketball offense scores and their opponents' scores, based on the '09/'10 historical data.
Much like MR's distribution-fitting capability, MR's copula-fitting capability can create MR Objects that represent the copulas. It is accessed through the same "Fit" command. As will be seen with the first drop-down menu, copulas can be created between either paired data sets (bivariate) or more than two sets of data (multivariate). With ModelRisk up and running within MS Excel, open the latest version of the Duke 09_10 Scores file. It does not matter what the active cell is when performing this operation:
- Select "Fit" in MR ribbon bar.
- Select "Bivariate Fit Copula" from drop-down menu.
- Select all the potential copulas from the list on left-hand side. (Use CTL-CLICK to select multiple copulas.)
- Select right-arrow button to place selected copulas into list on right-hand side.
- Select "OK."
- Using cell-reference-picker in "Source data" box in upper left-hand corner, identify Cells C4:D37 as the source data.
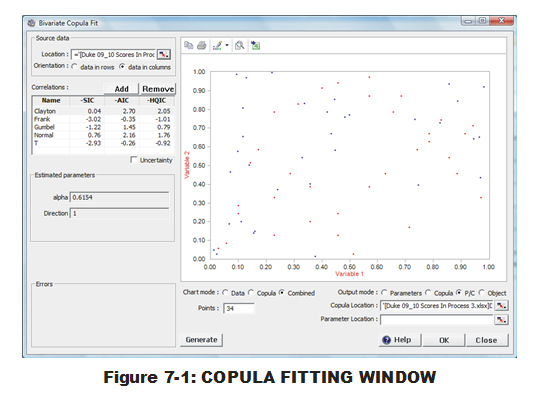
At this point, the user will be presented (Fig. 7-1) with scatter plot of both the data (red) and points representing sampled data produced with this copula (blue). (This can be manipulated to show only the data or the copula via radio buttons below.) A list of copulas appears beneath "Correlations:" (below the 'Source data' box in upper left-hand corner). Note that the same three criteria used in MR distribution-fitting are being employed here. Careful examination of the criteria values for all five Copulas are not consistent down the board so the user is recommended to click once on the top of each criteria column to understand how the criteria are in disagreement about the fitting order. It appears, however, that all three agree on the top two (Normal & Clayton) while the lower three remain in the same order.
The user decision of which copula to employ is fraught with more black magic than with selecting distributions. What are the significant differences between Normal and Clayton that would move a user to choose one over the other? For these bivariate copulas, it may not make a difference. If the basketball SME examined the scatter plot and deduced that positive correlation behavior was stronger at one end of the scoring scale (for both teams) than the other, the Archimedean Clayton would be more appropriate than Normal since it can reproduce that type of localized correlation. But this judgment is difficult to do with 34 samples. (Perhaps it could be justified if other teams have much better copula fits to Clayton than Normal?) For the current data set, we will use Bivariate Clayton since it was selected as best by two out of three criteria. We should still be uncertain about its suitability over Normal and question that assumption when more data arrives.
We will now use an option above the scatter plot to insert a MR Object into the spreadsheet. (This could also be done via options in the lower right-hand corner. However, it appears this is a remnant of an older feature, before MR Objects were implemented. By using the options in lower right-hand corner, the user must select the "OK" button for the appropriate MR entities to be placed into the spreadsheet. Unfortunately, that closes the Bivariate Copula Fit window when the user might want to do more in that window. The approach defined here allows the window to stay open after the operation is completed.)
- Select "Clayton" in the list of copulas beneath "Correlations:"
- Select the 'Excel-with-plus-sign' icon above displayed scatter plot.
- Select "Object" from drop-down menu.
- Select Cell U25.
- Select "OK." (These steps place the MR Object into the designated cell.)
- Select "OK" to exit the Bivariate Copula Fit window.
The MR Object for the Bivariate Clayton, as fit to the data, now resides in Cell U25. Just like with the MR Objects for distributions, we must add a few more details to our spreadsheet to connect this copula Object to the simulated values of the two PDFs. That is done by entering information into two cells that, when linked to the copula, will then connect a paired set of simulated values to two PDF Objects via the copula Object.
- Select Cells P24:P25 via click-and-drag.
- Enter "=VoseCopulaSimulate(U25)" and hit CTL-SHIFT-ENTER. (It is important to not just hit ENTER to conclude entry. The user is entering an array formula between two cells and must use CTL-SHIFT-ENTER to complete array formula entry properly. If done correctly, the user should see curly bracket around the formula displayed in the formula bar.)
- Select Cell P5.
- Modify formula to become "=VoseSimulate(U5, P24)" and hit ENTER.
- Select Cell P15.
- Modify formula to become "=VoseSimulate(U15, P25)" and hit ENTER.
The reason for this coupling is driven by how the VoseSimulate function provides sampled values. The first argument in a VoseSimulate function is referring to the MR Object of the distribution to be sampled from. If there is no second argument, VoseSimulate will randomly and without connection to any other distribution or copula, generate values. If there is a second argument, that value is specifying an exact percentile to be produced from the first argument's distribution Object. By specifying the second VoseSimulate arguments to relate back to the paired VoseCopulaSimulate functions in Cells P24:P25, we are forcing correlation into the two VoseSimulate functions.
One might argue that implementation of copulas in MR requires more fore-thought and work on the part of the analyst. Perhaps too much work? Does the user understand enough about copula behavior to use the linked formulas and create the appropriate correlation behavior during simulation? If not, a CB correlation interface (via the "Define Assumption" options), may be the best way to go. Perhaps the flexibility in using copulas is necessary (finance & insurance)? If yes, MR provides this capability while CB does not.
Let us stand back and consider pros and cons of either software for discrete distribution fitting and enforcing correlations in simulations. And the winner is … ?
Karl Luce is a Solutions Specialist who has a deep passion for using Monte Carlo analysis as a Six Sigma tool and quantifying uncertainty in the universe. His past roles included training Crystal Ball and quality concepts as a Design for Six Sigma (DFSS) Master Black Belt and a Six Sigma Transactional Black Belt. He received his BS in Aeronautical/Astronautical Engineering from M.I.T. in 1985. Prior to joining Oracle in 2005, Karl held analytical and managerial positions within Fortune 500 corporations in the defense aerospace and automotive industries.