All the top d ogs in the Monte Carlo Analysis spreadsheet universe have distribution-fitting capabilities. Their interfaces have common elements, of course, since they rely on (for the most part) the same PDFs in their arsenal of distribution-fitters. There are important differences, to be sure. It is hoped this comparison will illustrate pros and cons from a practical standpoint. Before going over our scorecard between Crystal Ball and ModelRisk, there is one more very important capability category begging for review: Correlation.
Correlation indicates a rough behavior, or a degree of relationship, occurring between two or more uncertain variables. It can be defined mathematically via a single value (or a few) but, being rough and not exact, it adds its own unique noise to the MCA world. I sometimes call it "a lazy causality." True, there might appear to be causality creeping out of the data. But any attempts to prove the causality (from a statistical hypothesis viewpoint) does not provide more confidence in a transfer function, like a polynomial derived from Design of Experiments (DOE). Still, we know this behavior is important so shouldn't our MCA software provide this capability between two random variable inputs? And how good should it be?
The answer is: It depends. (Don't you hate it when people say that?) Here is the primary reason that modeling correlation between uncertain variables is important: It affects the output variation, either by increasing or decreasing it. It does not affect the predicted mean. It does affect the predicted variance. (We can say this with a high degree of confidence. How much it affects the variance is another question. Along with the question of how much does it really matter.)
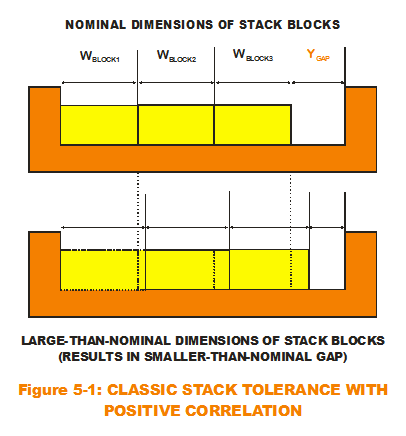 Here's how: Let us use the simplest type of additive model on the planet, the one-dimensional tolerance stack. There are three blocks stacked within the gap, making up our system. It is certain that the block widths will vary from assembly to assembly. But would they vary the same way (larger or smaller) for each assembly made? (See Figure 5-1.) That is, if Block 1 width is on the larger side (larger than the mean), would Block 2 width exhibit a tendency to be on the larger side? Since we are talking about blocks most likely randomly pulled from a box of blocks, any correlation would be minor. But what if they did? A positive correlation between Block 1 and Block 2 would accentuate any existing variation in the system output (the gap). That is, when Block 1 and Block 2 get wider at the same time, that has a tendency to influence the gap to its extreme minimum values (gets smaller more often). With positive correlations, there are fewer instances of "offsetting" variations (Block 1 is randomly wider while Block 2 is randomly smaller). Over many trials, correlation behavior accentuates variation in the output. Even though correlation may not exist for blocks (or bearings) and therefore not important to model (in the one-way clutch), it has been shown to rear its ugly head in other areas like finance. For some models, correlation is very important because it directly affect the risk predictions. It either shows them up as being too conservative or under-predicting the risk. Remember: Not the mean. But the standard deviation.
Correlations are traditionally calculated from paired data. Examine Figure 5-2. For all three plots, the axes match one uncertain variable (x1) against another (x2) and each point represents a pair of linked data points. The two variables were measured at the same time or for the same instance (very important). These scatter plots provide a sense for the magnitude of correlation. If there is no correlation between the two variables (as in the first plot), the random nature of their occurring values will "spread out" over the entire variable range space. However, as shown the next two plots with greater and greater positive correlations, order peeks out from the chaos. The paired data sets start to congregate around the diagonal of the plot. In the last plot, the correlation is so great that no data pairs are observed where x1 is low and x2 is high, as well as no pairs observed where x1 is high and x2 is low.
The most common calculation associated with correlation characterization is Pearson's product-moment coefficient. It was designed to indicate a degree of linear relationship between two variables. For values approaching +1, this indicates a positive correlation where both variables tend to increase or decrease together around their central tendencies. Values approaching -1 indicate a negative correlation where one variables tends to increase while the other tends to decrease. Pearson's coefficient uses the raw variable values but a similar calculation places the rank of those values (descending from greatest values to smallest) into the same formula. This version is called the Spearman's coefficient (or Rank Correlation coefficient, these are the values identified in Fig. 5-2).

Excel and MR provide functions to calculate these coefficients plus one more. When data1 and data2 are the ranges of the paired data cells, the formulas are:
- Pearson's Coefficient → =CORREL(data1, data2)
- Spearman's Coefficient → =VoseSpearman(data1,data2)
- Kendall's Tau Coefficient → =VoseKendallsTau(data1,data2)
Most decent MCA spreadsheet packages offer correlation capabilities using Spearman's because it is simple to accurately implement (relative to Pearson's) between random variables characterized by different distributions. In essence, the sampled variables retain the intended PDF behavior. At the same time, individual trial values from one variable are paired up with trial values from another variable, such that a calculated Spearman's coefficient approaches the desired correlation value (defined by the user).
ModelRisk stands apart from the crowd with a more sophisticated way to enforce correlations termed Copulas. The reason for this distinction is that correlation coefficients alone do not provide enough flexibility for certain classes of correlated variables. It is possible that two different correlation patterns discerned in scatter plots provide the same correlation coefficient. For particular finance or insurance simulations, this distinction is quite important. Without more flexibility to capture the appropriate correlation behavior, the analyst may either under-estimate or over-estimate the risk. And, as with distribution-fitting, MR offers criteria that indicate goodness-of-fit for the five closed-form Copulas in the MR arsenal. Again, this offers more flexibility to the user instead of simply plugging one single coefficient value that pairs up PDFs. (As a side note, MR also has an empirical data-fitting version for Copulas. CB does not.)
Now that the theoretical underpinnings of Correlations and Copulas have been discussed, let us use the Duke Basketball Scores to implement the behavior practically in our MCA spreadsheet alternatives.