Aug
10
2010

Tolerance Analysis is the set of activities, the up-front design planning and coordination between many parties (suppliers & customers), that ensure manufactured physical parts fit together the way they are meant to. Knowing that dimensional variation is the enemy, design engineers need to perform Tolerance Analysis before any drill bit is brought to raw metal, before any pellets are dropped in the hopper to mold the first part. Or, as the old carpenter's adage goes: Measure twice, cut once. 'Cause once all the parts are made, it would be unpleasant to find they don't go together. Not a good thing.
That is the obvious reason to perform Dimensional Tolerance Analysis; to avoid the "no-build" scenario. There are many other reasons: When parts fit together looser than intended, products feel sloppy. Perhaps they squeak & rattle when used, like that old office chair you inherited during a budget crunch. When parts fit together tighter than intended, it takes more time and effort for manufacturing to assemble (which costs money). The customer notices that it takes more effort or force to operate the moving parts. Like that office chair whose height adjuster you could never move. Either of these conditions will most likely lead to customer dissatisfaction. Even more disconcerting, there could be safety concerns where overloaded part features suddenly break when they were not designed to bear loads.
Here is another way to look at Tolerance Analysis: One group designs the part; another one makes it (whether internal manufacturing or external suppliers). So the group that makes things needs to know what values the critical nominal dimensions of the manufactured parts should be and how much variation can be allowed around those values. Some parts go together in fixed positions; some allow relative motion between the parts. For the latter, there is a need to specify the smoothness or finish of the mating surfaces (in order that they move effortlessly as intended). The communicated nominal dimensions and their allowable variation sets up a reference framework by which all parties can identify the critical dimensions and perhaps even set up regularly-scheduled measurements to ensure that one month, ten months, even five years down the road, those part dimensions are conforming to the design intentions.
To the trained CAD operator (those people who draw shapes on computer screens in dimly-lit cubicles), these activities describe Geometric Dimensioning & Tolerancing (GD&T). It is generally considered to be the godfather of modern Tolerance Analysis. It provides discipline and rigor to the management (identifying and communicating) of allowable dimensional variation via standardized symbols. Depending on the part feature of interest, there are quite a few different kinds of symbols that apply to feature types, such as flat surfaces, curved surfaces, holes and mating features like notches or tabs.
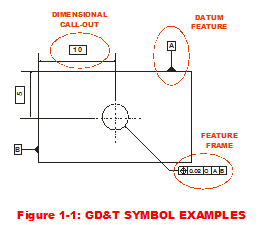
 Examples of GD&T terminology & associated symbols as shown in Figure 1-1 are:
- Dimensional Call-outs or numerical values with arrows indicating the dimension of interest
- Feature Frames or boxes that point to a particular feature with a myriad of mystical symbols
- Datum Feature indicates a part feature that contacts a Datum, which is a theoretically exact plane, point or axis from which dimensions are measured.
- Datum Reference Frames (DRF) fulfill the need to define a reference frame via a set of three mutually perpendicular datum planes (features).
- Critical Characteristics (CC) are a subset of dimensions whose production control is absolutely critical to maintain for safety concerns. (That will lead us further down the path of Statistical Process Control (SPC).)
But how does a designer or engineer know how much dimensional variation could be allowed in a part so that the GD&T guys can define those mystical symbols? I intend on answering that question in the following series of posts summarizing the primary approaches a design engineer should consider when performing Tolerance Analysis. I will expand on and compare three approaches to illuminate their strengths and weaknesses:
- Worst Case Analysis
- Root Sum Squares
- Monte Carlo Simulation
Creveling, Clyde M., Tolerance Design: A Handbook for Developing Optimal Specifications (1997); Addison Wesley Longman, pp. 3-11.
Sleeper, Andrew D., Design for Six Sigma Statistics (2006); McGraw-Hill, pp. 765-769.
Karl Luce is a Solutions Specialist who has a deep passion for using Monte Carlo analysis as a Six Sigma tool and quantifying uncertainty in the universe. His past roles included training Crystal Ball and quality concepts as a Design for Six Sigma (DFSS) Master Black Belt and a Six Sigma Transactional Black Belt. He received his BS in Aeronautical/Astronautical Engineering from M.I.T. in 1985. Prior to joining Oracle in 2005, Karl held analytical and managerial positions within Fortune 500 corporations in the defense aerospace and automotive industries.