 The other RSS equation, that of predicted output mean, has a term dependent on 2nd derivatives that is initially non-intuitive:

Why is that second term there?
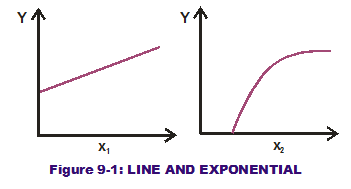
Examine the two curves in Figure 9-1. The first is the line and the second an exponential. The 2nd derivative of a curve captures the changing-slope behavior of a curve as one moves left-to-right. In the first curve, the slope does not change across the range of input values displayed. Its slope (1st derivative) remains constant so therefore its 2nd derivative is zero. But the slope of the exponential does change across the input value range. The slope initially starts as a large value (steep) and then gradually levels out (not so steep). Its 2nd derivative is a negative value as the slope goes down (as opposed to going up) across the value range.
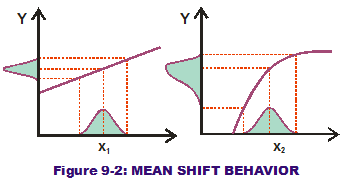
Applying the same normal input variation to both curves results in different output distributions. The exponential distorts the normal curve when projecting output variation (see Figure 9-2). Half of the input  variation is above those normal curve centers (means) while the other half is below. When we project and transfer this variation through the line, note that the slope above and below the center point of transfer is equal. This will transfer half of the variation through the slope above the point of interest and half below. Thus the straight line projects a normal curve around the expected nominal response. The output mean is not shifted.
When we project and transfer the normal input variation through the exponential curve, something different happens. Since the slope changes around the point of interest (it is a greater slope with the lower half of the normal input variation and a lesser slope with the upper half), it has the effect of distorting the "normal" output curve. The lower half of input variation drives in a wider range of output variation than the upper half does; it has a longer tail. This has the effect of skewing the distribution and "shifting" the mean output response downwards. By placing the 2nd derivative value (which is negative) in the RSS output mean equation, the same effect is capture mathematically. A negative 2nd derivative value "shifts" the mean downward as the exponential curve does to our output variation.
Now with visual concepts and understanding around RSS planted in our minds, let us turn the spotlight on the topic of Monte Carlo Analysis.