 A few posts ago, I explained the nature of transfer functions and response surfaces and how they impact variational studies when non-linearities are concerned. Now that we have the context of the RSS equations in hand, let us examine the behavior of transfer functions more thoroughly.
Sensitivities are simply the slope values (1st derivatives) of the transfer functions. If I take "slices" of a two-inputs-to-one-output of the response surface, I can view the sensitivities (slopes) along those slices. But why are steeper slopes considered more sensitive?
Examine Figure 8-1. It shows three mathematical representations of a one-input-to-one-output transfer function. These curves (all straight lines) represent three different design solutions under consideration. When the designer selects the mid-point of the horizontal axis as his design input value (x0), all three transfer functions provide the same output (Y0) response value along the vertical axis. What makes one better than the others?
Now examine Figure 8-2. We have added a 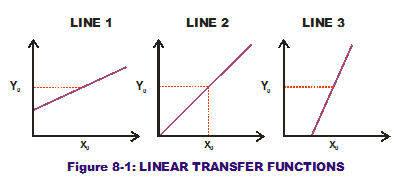 variational component to the input values in the form of a normal curve along the horizontal axes. Remember that the height of the PDF shown indicates some values are more likely to occur than others. The variability shown in the input can be transferred to the output variation through the transfer function curve. For the first line, this results in a normal curve on the response with a known standard deviation (as shown on the vertical axis). For the second line, this also results in a normal curve but one that has a wider range of variation (a larger standard deviation). For the third and steepest line, we get another normal curve with an even greater range of variation. The first line (or design solutio
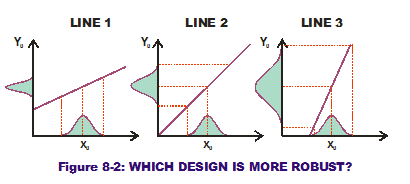 n under consideration) produces less variation (less noise) on the output when input variation is same for all three scenarios. It is a more Robust Design than the other two (less sensitive to noise in the input variations).
What if there are multiple inputs to our one output? Does one input's variation wreak more havoc than another input's variation? This is the question that Sensitivity Contribution attempts to answer. Consider the response surface in Figure 8-3, a completely flat surface that is 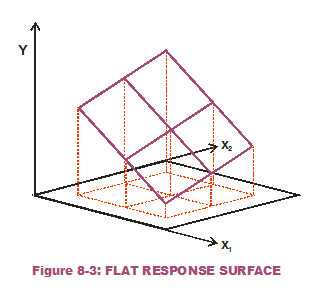 angled to the horizontal plane (not level). Figure 8-4 displays the slices we cut while holding x1 constant at different values and doing the same for x2. Note that the slopes (which are constant and do not change over the input range of interest) are of a lesser magnitude when x1 is held constant versus when x2 is held constant. That means the response is less sensitive to variation in the second input (x2) than the first input (x1). (As a side note: The steeper slices, when x2 is held constant, have a negative sign indicating a downward slope.)
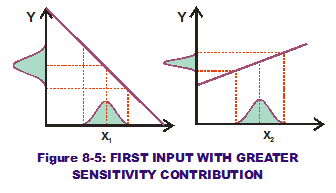
If we apply the same variation to both x1 and x2 (see Figure 8-5), it is obvious that the first input causes greater output variation. Therefore, it has a greater sensitivity contribution than that of the second input.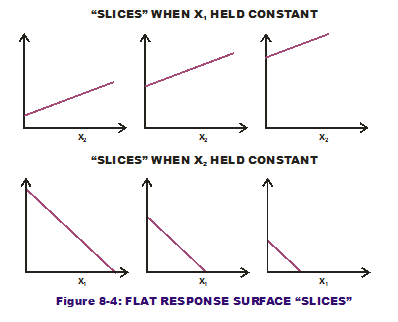
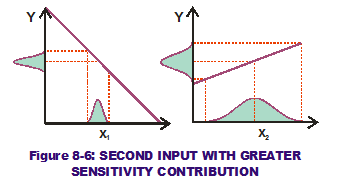
We can flip the tables, however. What if the variation of x2 was so much greater than that of x1? (See Figure 8-6.) It is possible that, after the variation of x1 and x2 have been "transferred" through the slopes, that the corresponding output variation due to x2 is greater than that from x1. Now the second input (x2) has a greater sensitivity contribution component than the first input (x1), even though the first input has a greater sensitivity than the second input. By examining the RSS equation for output variance (see below), it can be seen why this is the case.
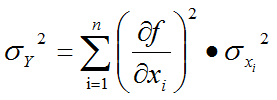
If either the slopes (1st derivatives) of a design solution of interest or the variation applied to those slopes (the input standard deviations) is increased, that input's sensitivity contribution goes up while all the others go down. The pie must equal 100%.
So we now know how much pie there is to allocate to the individual input tolerances, being based on the sensitivities and input variations. Let us stop eating pie for the moment and look at the other RSS equation, that of predicted output mean. (RSS is really easy to understand if you look at it graphically.)