This post presents 2 popular learning curve methods for estimating how a person or organization benefits from repeat learning.
This technique is key for the project risk analyst.
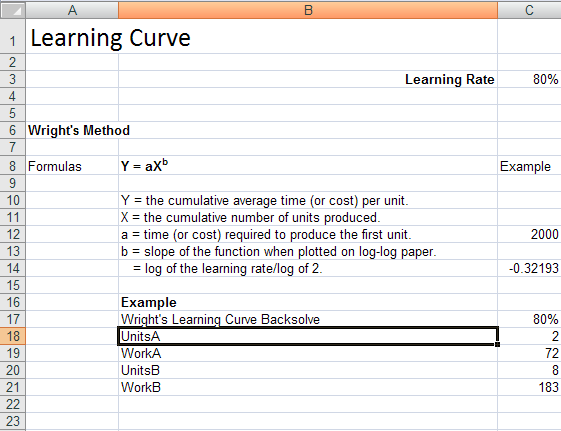
There are many methodologies for evaluating the cost of something over time. The old addage "practice makes perfect" is quite appropriate here. What is even more fascinating is that studies and many years of research have concluded that learning follows a fairly constant rate. Wright's (1936) approach considered that anytime units would double their would be a X% improvement. Wright's formula is pretty straight forward to apply:
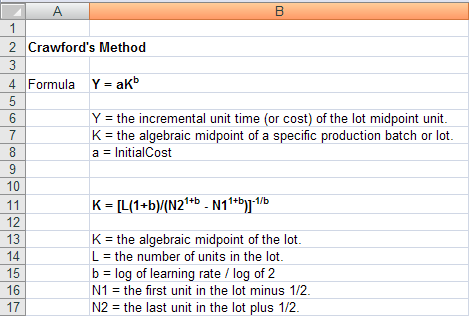
The formula below presents Crawford's method for finding a Lot's mid-point. Try to remeber that Crawford's approach for cumulative totals and averages is different but easy to model in Excel. The starting point is InitialEffort * (LotUnits ^ b) as show below. You don't need to solve for K if you are using Excel. Just build a table!
To calculate cumulative average under Crawford requires you to calculate the formula (InitialEffort * (LotUnits ^ b)) iteratively for each cumulative unit then to add them up and divided by the total units . For the cumulative total, repeat the process but leave out the division. Selecting the right learning curve is usually determined by statistical analysis of actual cost data for similar products. Lacking that, you can use the following guidelines from Stewart's "Cost Estimator's Reference Manual- 2nd Ed.,"
| Rules of thumb for evaluating a learning curve for manufacturing |
Rules of thumb for evaluating a learning curve by project type
|
- 75% hand assembly/25% machining = 80% learning
- 50% hand assembly/50% machining = 85%
- 25% hand assembly/75% machining = 90%
|
- IT Projects 85 - 95% (This varies greatly for org. to org.)
- Aerospace 85%
- Shipbuilding 80-85%
- Complex machine tools for new models 75-85%
- Repetitive electronics manufacturing 90-95%
- Repetitive machining or punch-press operations 90-95%
- repetitive electrical operations 75-85%
- Repetitive welding operations 90%
- Raw materials 93-96%
- Purchased Parts 85-88%
|
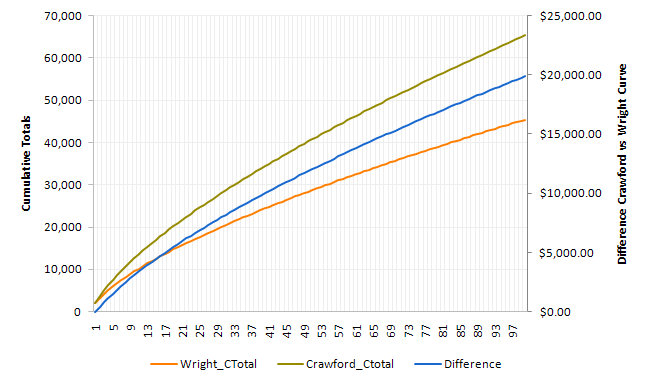
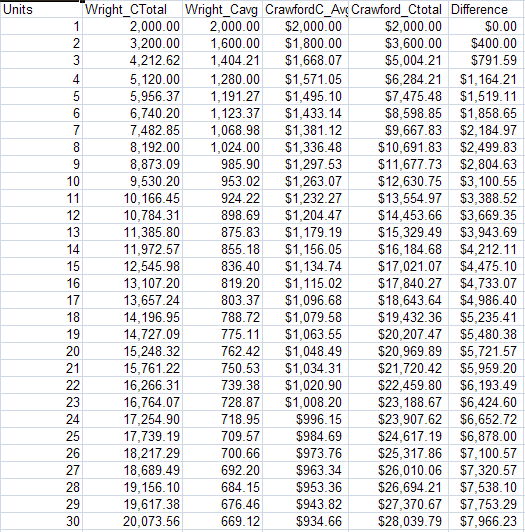
The graph and table below outlines the differences between both methods. Both cumulative averages and totals are different. Crawford is far more conservative than Wright. So as in anything, you will need to fit the method that is best or most reflective of your reality. This example is constructed using an 80% learning curve with a First Unit cost of 2000$
If you have any questions or would like to apply this in your project planning, drop me a line : [email protected]